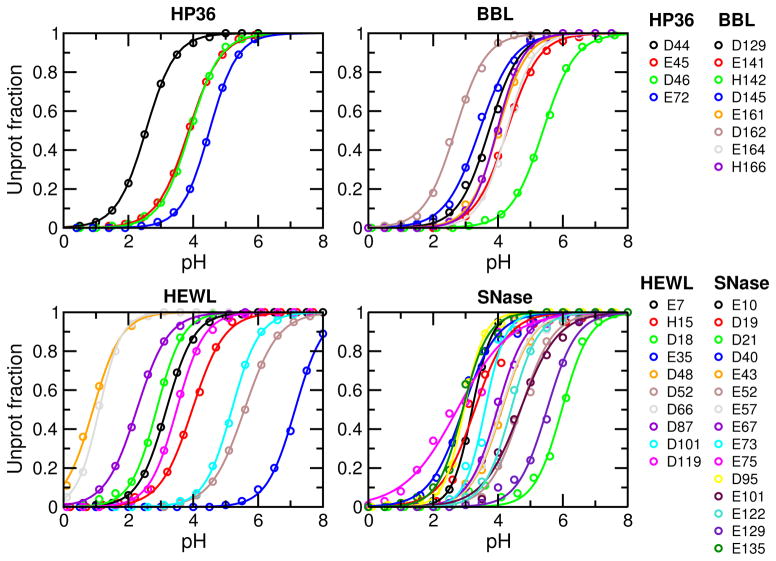
Figure 3.
Titration plots of HP36, BBL, HEWL and SNase. Unprotonation fractions at different pH were calculated based on the 10-ns CpHMD simulations. Solid curves represent best fits to the generalized HH equation. For all curves, chi-square of fitting is in the range 0.00017–0.038 and correlation coefficient is in the range 0.9955–0.999965.

