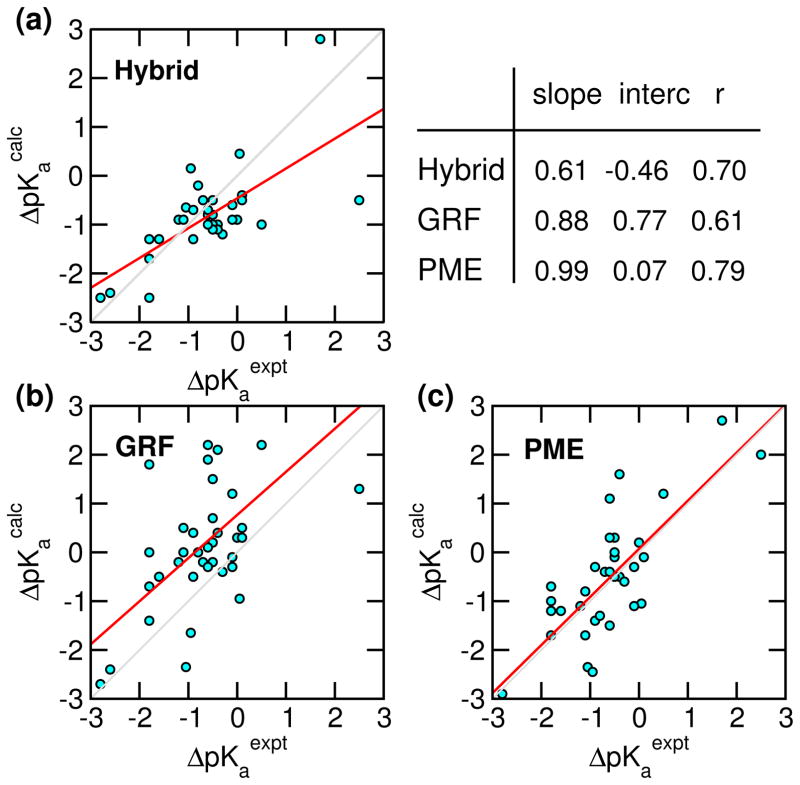
Figure 4.
Correlation between the experimental and calculated pKa shifts relative to model compound values for hybrid-solvent, GRF-, and PME-based CpHMD simulations. The diagonal gray line is added to guide the eye. The red line represents linear regression with the slope, intercept (interc) and correlation coefficient (r) indicated. The corresponding pKa’s are given in Table 2.

