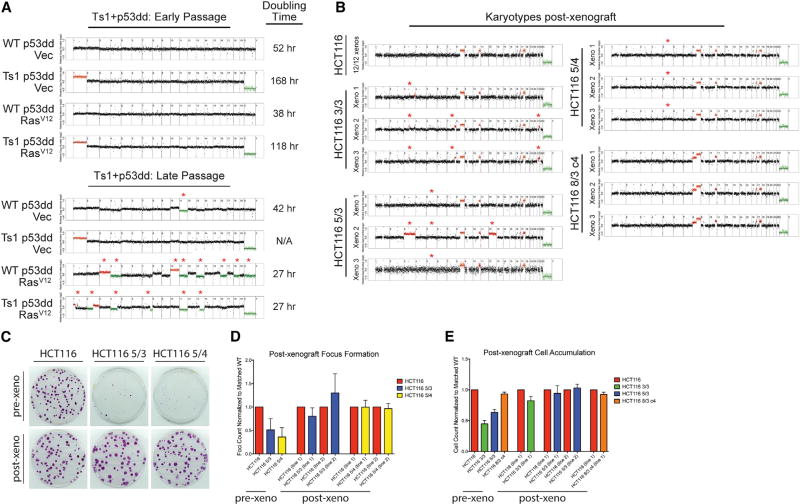
Figure 7. Karyotype Evolution Correlates with Enhanced Growth in Aneuploid Cell Lines.
(A) Karyotype analysis of the Ts1+p53dd + RasV12 experiment, initially presented in Figure 3A, is displayed. Whole-genome sequencing at passage 2 revealed that the slow-growing line maintained its initial karyotype, while whole-genome sequencing at passage 10 revealed that the rapidly growing line had lost the trisomy of mChr1 and displayed several further chromosomal gains and losses. Note that the early-passage karyotype analysis is also displayed in Figure S2B, and is presented here for reference.
(B) HCT116 xenografts, initially presented in Figure 5H, were extracted, digested with trypsin, and then plated on plastic. Low-pass whole-genome sequencing revealed that 12 HCT116 xenografts and 3 HCT116 8/3 c4 xenografts maintained their initial karyotypes. However, all HCT116 3/3, 5/3, and 5/4 xenografts lost their initial trisomies or tetrasomies during in vivo growth, and several lines displayed additional chromosomal CNAs. Deviations from each cell line’s initial karyotype are indicated with an asterisk in (A) and (B).
(C) Comparison of the focus-formation ability of HCT116 cells before or after growth as a xenograft.
(D) Quantification of the focus-formation assay in (C).
(E) Proliferation assay of HCT116 cells before or after growth as a xenograft. Error bars indicate the SEM.
See also Figures S7 and S8.

