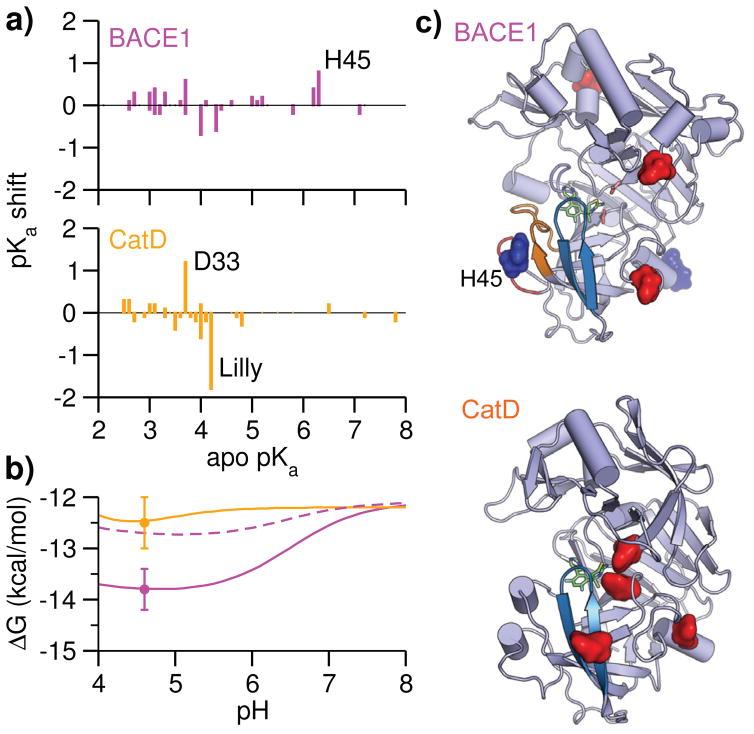
Figure 3. Inhibitor selectivity for BACE1 relative to CatD is pH dependent.
a) Calculated pKa shifts vs. apo pKa’s for BACE1 and CatD. The pKa shift is defined as pKa holo - pKa apo. The block standard errors (BSE) for pKa shifts are mostly below 0.2 units (Table S1 and S2). b) pH-dependent absolute binding free energies of BACE1 (solid magenta, without the His45 contribution is shown in dashed magenta) and CatD (orange). ΔG at pH 8 (reference pH) was calculated with the double decoupling scheme (Table 1), while the pH dependence was calculated with Eq. 2 using apo and holo pKa’s of BACE1 (Table S1) and CatD (Table S2). The error bars are shown for ΔG at pH 4.6 (see Table 1). Considering that several acidic pKa’s could not be reliably determined, (Table S1 and S2), the pH profile below 4 is not shown. c) Spatial view of residues contributing to the pH-dependent binding free energies of BACE1 and CatD. Asp/Glu are colored red and His sidechains are colored blue.

