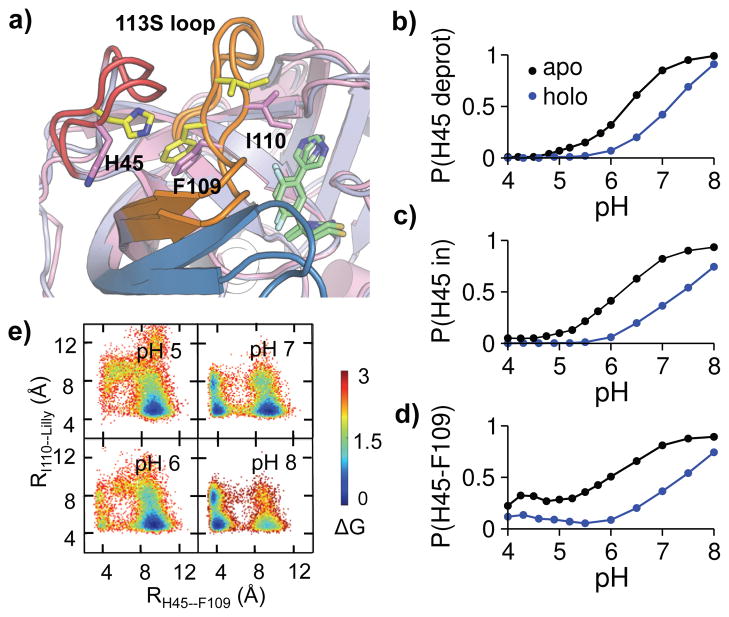
Figure 5. Protonation of His45 is coupled to the BACE1-inhibitor binding affinity change through conformational allostery.
a) Overlaid snapshots showing two dominant conformations: His45 in/His45–Phe109 contact (yellow), His45 out/I110–inhibitor contact (magenta). b) Probability of His45 deprotonation at different pH. c) Probability of His45-in rotation at different pH. His45 in is defined by χ1 > 140° or χ1 < −140°. d) Probability of His45–Phe109 contact formation at different pH. Based on the probability distribution of the His45–Phe109 distance, a contact is considered present when the distance is below 6 Å (Fig. S1). e) Free energy surface as a function of His45 (CE1)–Phe109 (CB) and Ile110 (CD)–inhibitor (C23) distances in holo BACE1 at different pH. For b-d, the apo and holo states are shown in black and blue, respectively.

