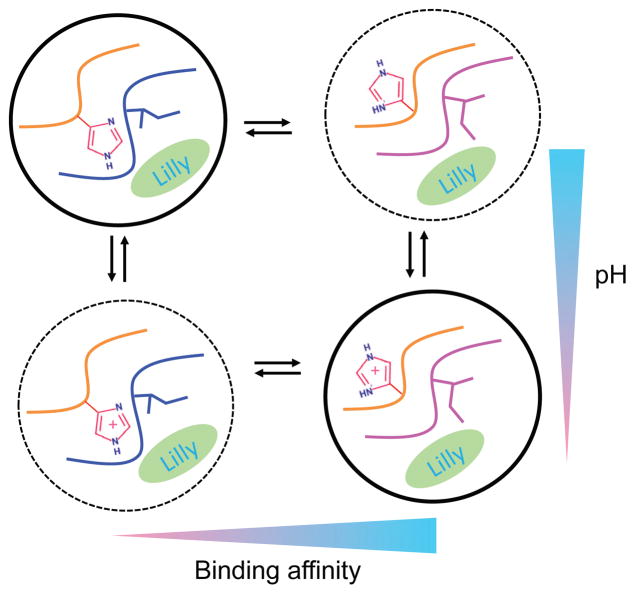
Figure 6. Schematic view of the protonation-coupled conformational allostery in BACE1.
Protonation equilibria are shown vertically, while conformational changes are shown horizontally. Dominant states are indicated by circles with solid lines. His45, Ile110 and the inhibitor are explicitly shown. The loop that has His45 and the 113S loop that has Ile110 are also displayed.

