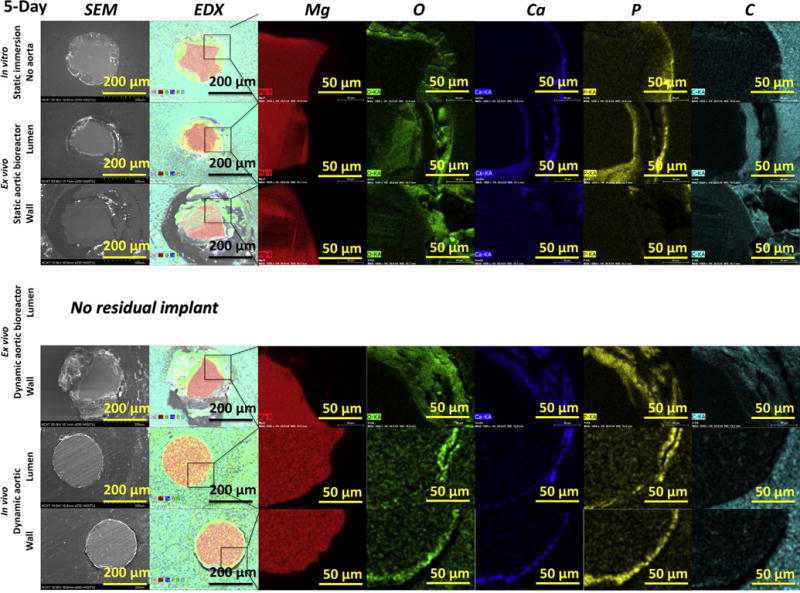
Fig. 7.

Cross-section SEM images with EDX mapping analysis of the samples after 5 days. No images exist for the dynamic ex vivo aortic lumen in the bioreactor, since no residual implant was left. Second column are EDX overlay images for the elements Mg (red), O (green), Ca (blue), P (yellow) and C (cyan), shown separately in the right columns. (For interpretation of the references to colour in this figure legend, the reader is referred to the web version of this article.)
