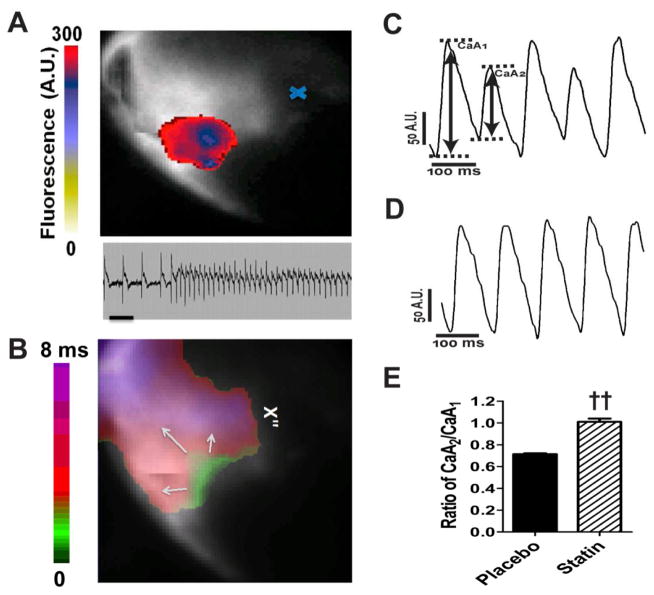
Figure 3.
Optical mapping of Ca2+ transient alternans in infarcted hearts from Akita mice. A. VT is focal, originating in the peri-infarct zone. The colored voltage fluorescence snapshot of the first tachyarrhythmic beat is superimposed on the fluorescence image of the heart. The scale indicates the fluorescence in arbitrary units, and the blue x indicates the location of the ligation site. Lower panel. The ECG is of the tachycardic episode mapped above. Scale bar: 200ms. B. Activation map demonstrating the initiation of VT in the peri-infarction zone. C. Ca2+ transients recorded from the peri-infarct zone 12 hours following coronary artery ligation in epicardially paced hearts at 12Hz from B. placebo treated and D. pravastatin treated Akita mice. E. Alternans ratio of Ca2+ transients in hearts from placebo and pravastatin treated mice defined as A2/A1. ††P<0.01 vs placebo.

