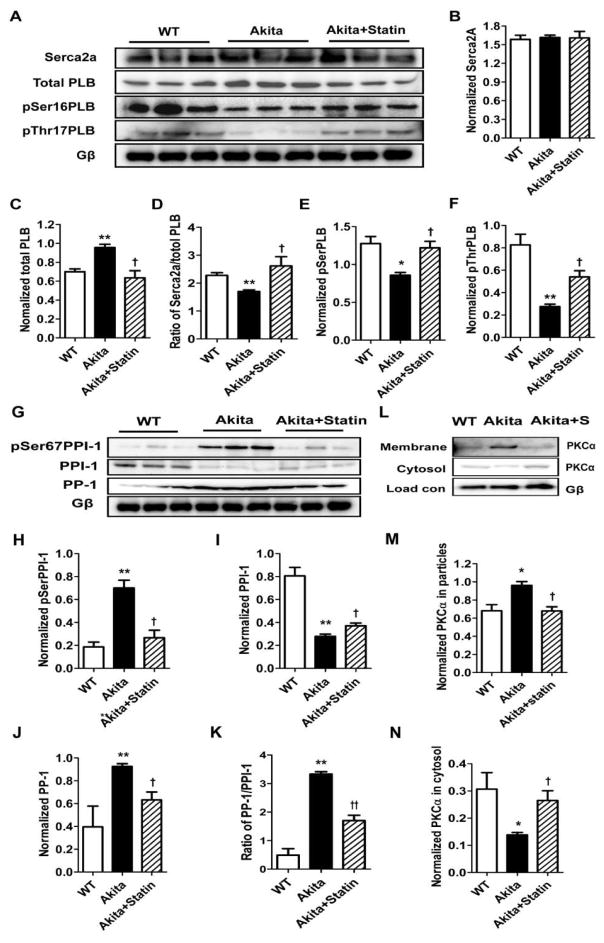
Figure 8.
Comparison of expression of major Ca2+ handling and PKCα proteins in ventricular extracts from WT, Akita and pravastatin treated Akitas. Western blotting demonstrates changes in protein levels among the 3 groups, A, G and L. Bar graphs represent data normalized to Gβ levels. *P<0.05, ** P< 0.01 compared with WT; † P<0.05, ††P< 0.01 compared with Akita.

