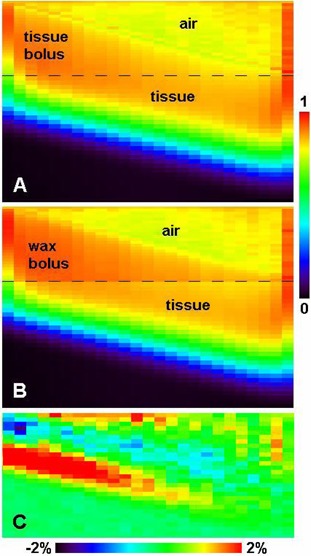
Figure 4.

The sagittal view of the central cut through the dose distributions produced by the 15 MeV beam on the wedge bolus and tissue phantom, (A) when the wedge is simulated as tissue, (B) when the wedge is simulated as wax, and (C) the dose difference of A‐B in the homogeneous tissue phantom (wedge and air regions not included). The percentage difference is normalized to the global maximum. All doses are normalized to the global maximum dose in the wax wedge setup. The bolus–tissue phantom interface is illustrated by the dark long dashed lines in (A) and (B).
