Figure 6.

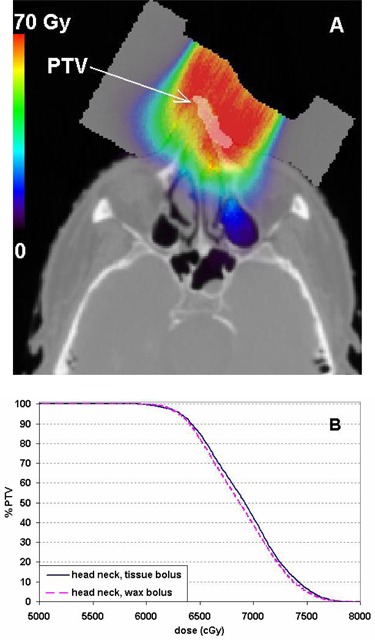
The MC calculated dose distribution (A) with the bolus assigned as wax on a head‐and‐neck case with the PTV highlighted. PTV DVH comparison (B) between the calculations with the bolus simulated as tissue or wax.

The MC calculated dose distribution (A) with the bolus assigned as wax on a head‐and‐neck case with the PTV highlighted. PTV DVH comparison (B) between the calculations with the bolus simulated as tissue or wax.