Figure 8.

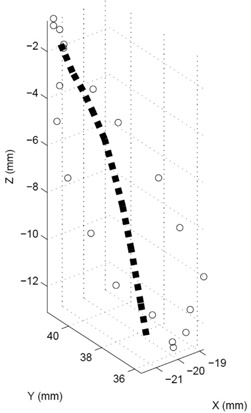
Tracks calculated with 4D TDR (dotted line) compared with 4D CT measurements (circles). Note the hysteresis shown in the 4D CT measurement.

Tracks calculated with 4D TDR (dotted line) compared with 4D CT measurements (circles). Note the hysteresis shown in the 4D CT measurement.