Figure 1.

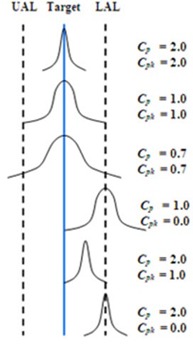
Distributions with different capability ratio () and acceptability ratio () showing their relationship to the process target, upper action limit (UAL), and lower action limit (LAL).

Distributions with different capability ratio () and acceptability ratio () showing their relationship to the process target, upper action limit (UAL), and lower action limit (LAL).