Figure 4.

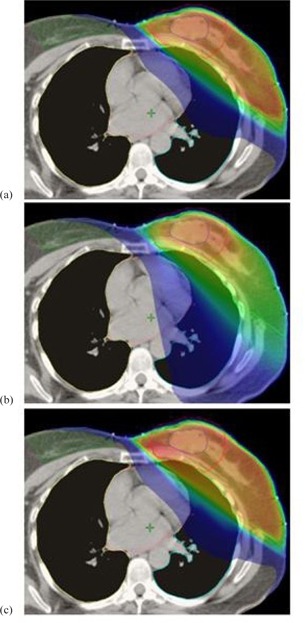
Example of a dose distribution on a CT axial slice down to 5% level for a Group B upper‐inner case: (a) CG‐Darc, (b) RapidArc, and (c) 3D CRT. The low‐dose splash to normal tissue is the same for CG‐Darc and 3D CRT, but more for RapidArc.

Example of a dose distribution on a CT axial slice down to 5% level for a Group B upper‐inner case: (a) CG‐Darc, (b) RapidArc, and (c) 3D CRT. The low‐dose splash to normal tissue is the same for CG‐Darc and 3D CRT, but more for RapidArc.