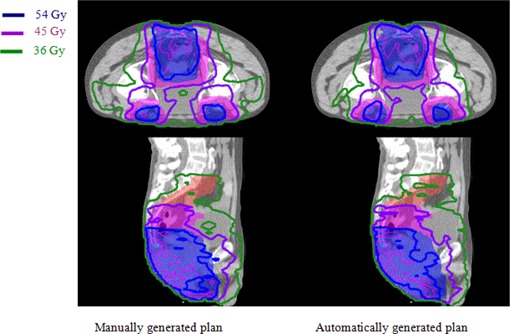
Figure 8.

Comparison of dose distributions on a transverse and a sagittal slice for anal canal case between manually and automatically generated IMRT plans. Red, pink, and blue shaded volumes are PTV36, PTV45, and PTV54, respectively, covered by the isodose line 36 Gy shown in green, 45 Gy shown in purple, and 54 Gy shown in blue, respectively.
