Figure 9.

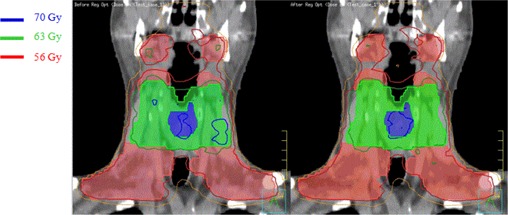
Comparison of dose distribution on the coronal slice for a head and neck case before (left) and after (right) automated regional optimization. Shaded volumes are PTV70 (blue), PTV63 (green), and PTV56 (red), respectively.

Comparison of dose distribution on the coronal slice for a head and neck case before (left) and after (right) automated regional optimization. Shaded volumes are PTV70 (blue), PTV63 (green), and PTV56 (red), respectively.