
Fig. 2. Substrate interactions with the catalytic region in the PaTrm5a-tRNAPhe-SAH ternary complex.
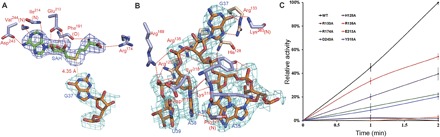
(A) The recognition pattern of SAH. The residues participating in ligand recognition are depicted in a ball-and-stick model and labeled. The hydrogen bonds are shown by the red dashed lines (distance, <3.6 Å). The distance of the S atom of SAH to N1 of G37 is shown by the yellow dashed line. (B) The recognition of the anticodon bases A35-U39. (C) Time course of the relative methyltransfer activities of PaTrm5a and mutants that are involved in substrate recognition. The measurements were made at 1- and 2-min time points. The activity of wild-type (WT) PaTrm5a at the 2-min time point was normalized to 100%, and the readings at time point zero were used as blanks. Error bars represent SD calculated from at least three measurements. All the 2Fo − Fc maps are contoured at 1σ.