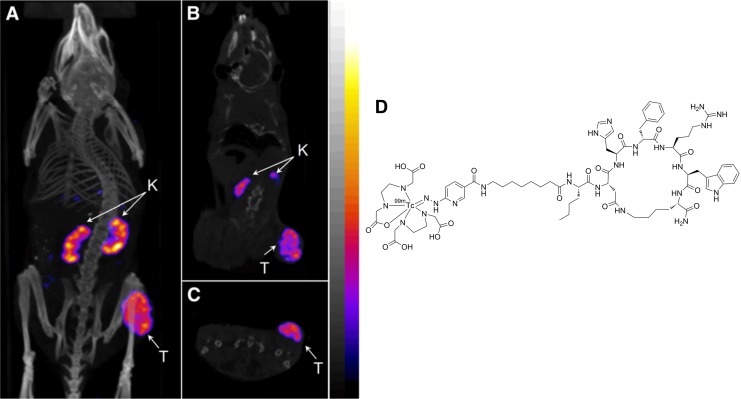
Figure 3.
Representative SPECT/CT images of 99mTc(EDDA)-HYNIC-AocNle-CycMSHhex in C57 mice bearing B16F1 melanoma tumors at 2 hours postinjection. (A) Whole body, (B) coronal, and (C) transversal images. (D) Chemical structure of 99mTc(EDDA)-HYNIC-AocNle-CycMSHhex. This research was originally published in JNM48 and adapted with permission by the Society of Nuclear Medicine and Molecular Imaging, Inc. CT denotes computed tomography; K, kidney; SPECT, single-photon emission computed tomography; T, tumor.

