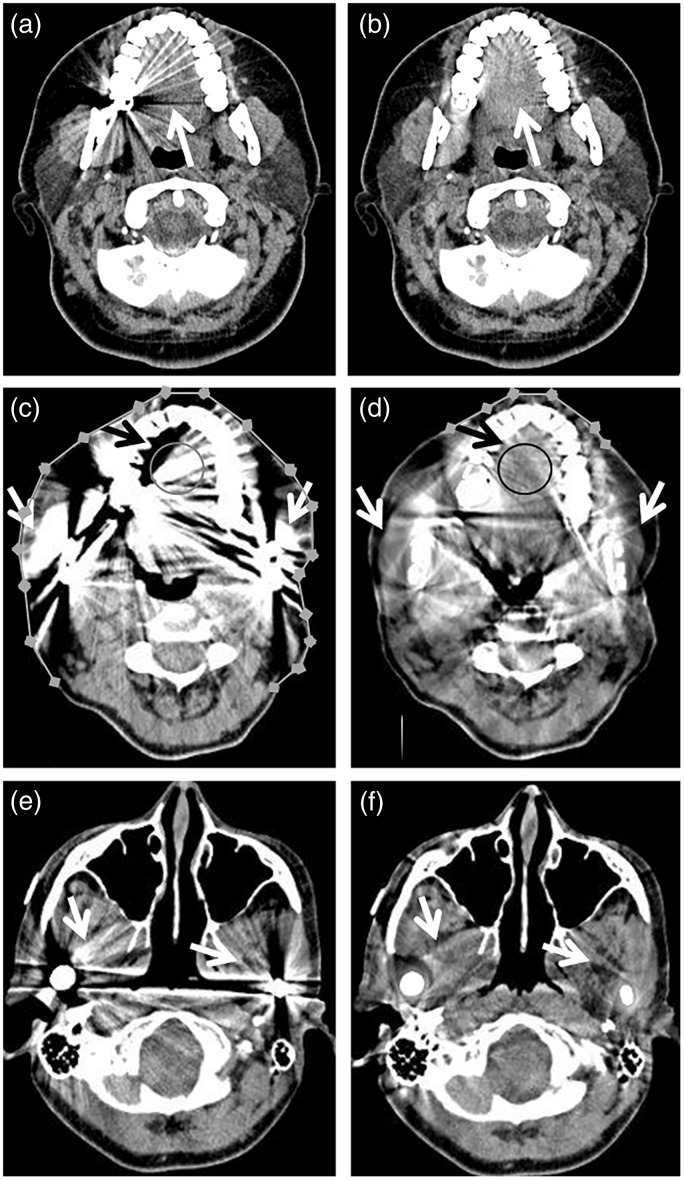
Fig. 2.
Improved soft-tissue visualization with IMAR images. wFBP (left column, a, c, e) and IMAR (right column, b, d, f) images from two different patients: 41-year-old woman with dental fillings (a, b) and 54-year-old woman with dental fillings and bilateral mandibular hardware (c–f). The IMAR images (b, d, f) have reduced metal artifact compared with the wFBP images (a, c, e). This is particularly evident at the tongue (white arrows in (b) vs. (a), black arrows in (d) vs. (c)), the structure most affected by artifact in all 24 patients in this study. Samples of the circular ROIs drawn by the PI in the tongue are shown in (c, d); similar size ROIs were also drawn in unaffected regions within the floor of the mouth (more inferiorly) to serve as artifact-free reference for HU measurements (not shown). In this example, the mean CT number at the tongue on the wFBP image (c) was 204 HU, much higher than on the IMAR image (d), 97 HU. Additional objective artifact evaluation involved readers drawing multiple connected line segments to measure the length of skin affected by artifact (c, d). In this example, the length of skin affected by artifact was much longer on the wFBP image than the IMAR image, 264 mm vs. 55 mm. The soft tissues adjacent to the bilateral mandibular hardware (white arrows in c–f) are also much less affected by artifact in the IMAR (d, f) than the wFBP (c, e) images.

