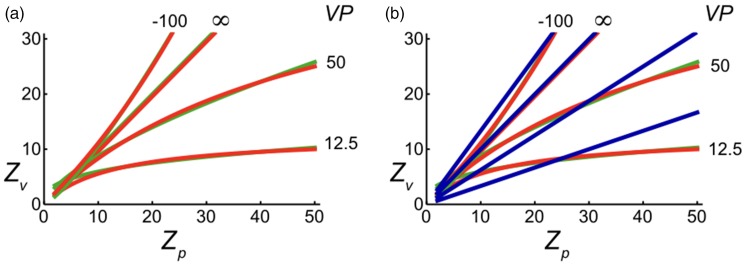
Figure 6.
Comparison of distance functions. (a) Hyperbolic functions (red) are fitted to power functions (green) predicting relationships between visual (Zv) and physical (Zp) distance. Distances of the vanishing point (VP) specify the hyperbolic functions. (b) Linear contraction functions (blue) are fitted to power (green) and hyperbolic functions (red). Zv, Zp, and VP are distances expressed in meters.

