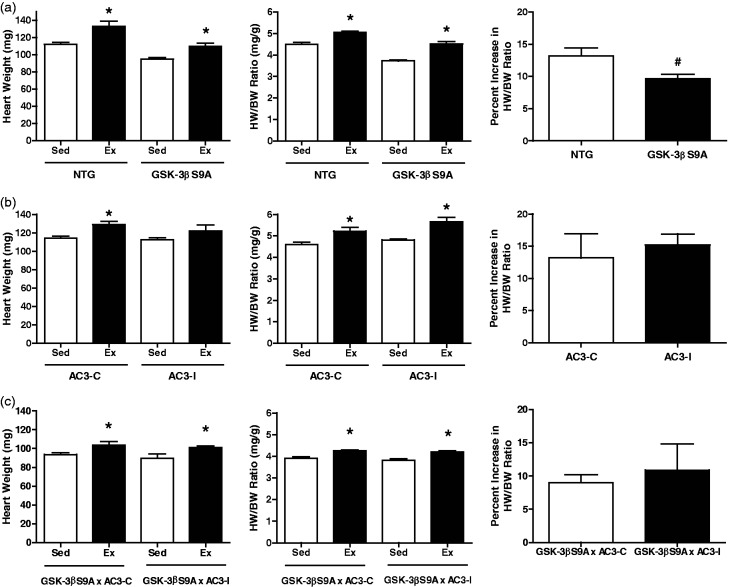
Figure 1.
Morphometric data and cardiac adaptation in response to 21 days of exercise for GSK-3βS9A and AC3-I female mice. (a) GSK-3βS9A and NTG littermate controls: Left: heart weight. Middle: heart weight normalized for body weight (HW/BW) ratio. Right: percent increase in HW/BW ratio. (b) AC3-I and AC3-C controls: Left: heart weight. Middle: heart weight normalized for body weight (HW/BW) ratio. Right: percent increase in HW/BW ratio. (c) GSK-3βS9A × AC3-I and GSK-3βS9A × AC3-C female mice: Left: heart weight. Middle: heart weight normalized for body weight (HW/BW) ratio. Right: percent increase in HW/BW ratio. *, P < 0.05 relative to sedentary counterparts; #, P < 0.05 relative to NTG exercised mice. n = 5–14 animals per group. Data are reported as mean ± SE

