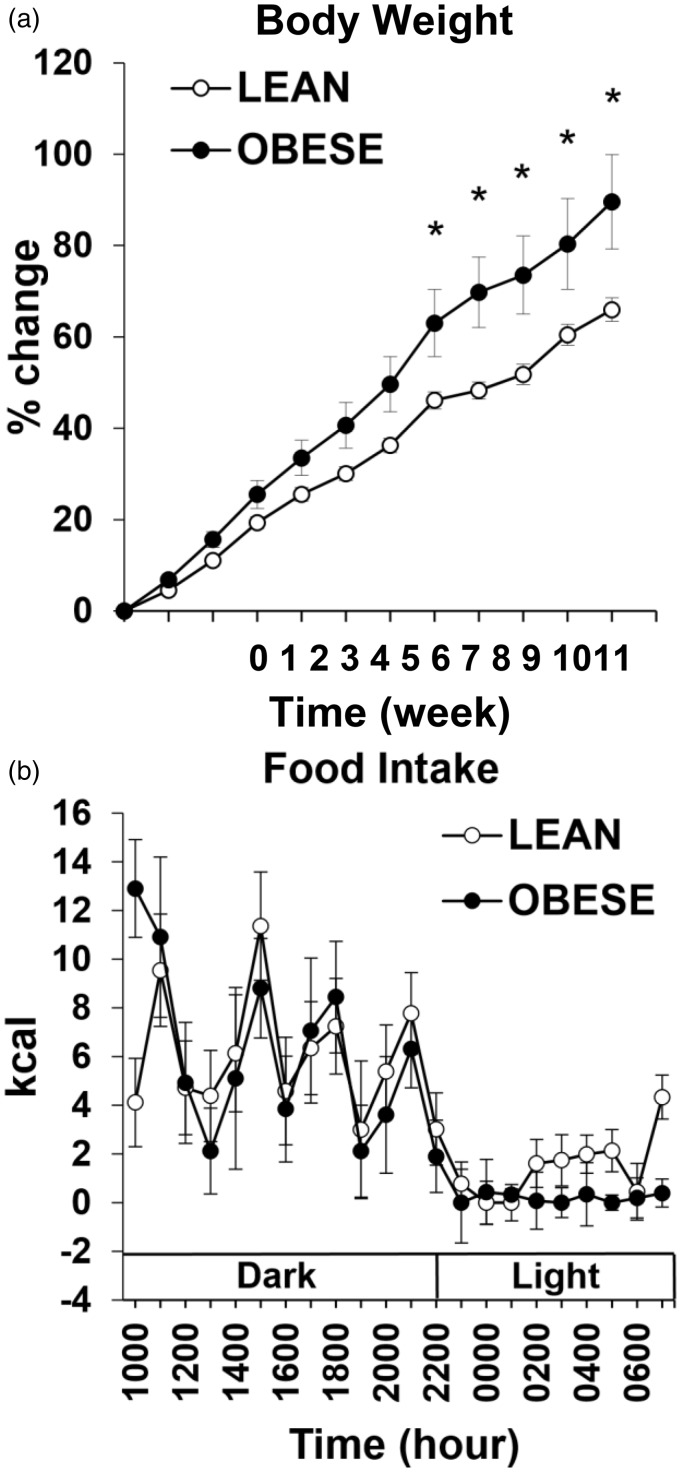
Figure 1.
Weekly percent change in body weight of both LEAN and OBESE groups over 11-week period (a). Average hourly food intake measured in kcal of LEAN and OBESE groups across wks 8 and 9 (b). • represents OBESE (high-fat fed) animals and ○ represents LEAN (chow-fed) animals. Values are mean ± SEM. *p ≤ 0.05 OBESE compared with LEAN.

