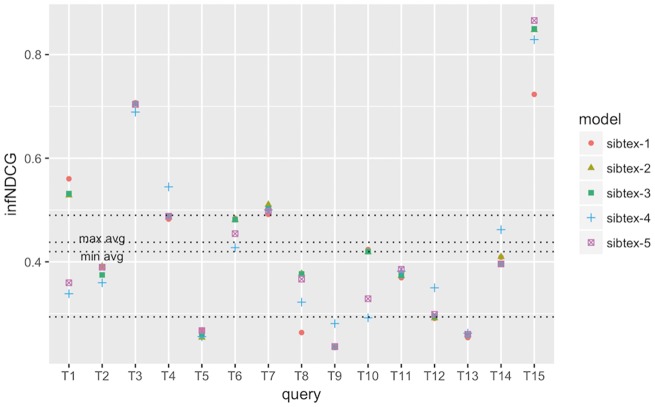
Figure 3.
infNDCG performance at the query level for SIB Text Mining models. Results obtained using 5-fold cross-validation. Lowest horizontal line: 1st quartile computed for all results. Highest horizontal line: 3rd quartile computed for all results. min avg horizontal line: minimum infNDCG among the five models. max avg horizontal line: maximum infNDCG among the five models.

