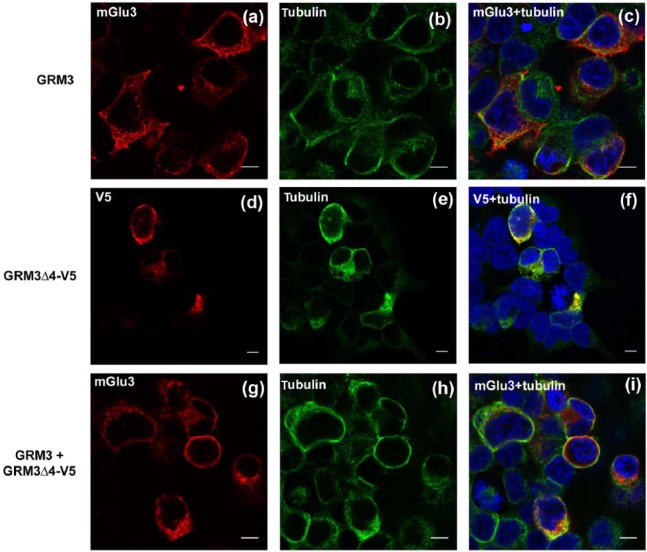
Figure 3.
Immunofluorescence reveals predominant membrane localization of mGlu3 and mGlu3Δ4. (a)–(c) Transfection of GRM3, showing immunoreactivity for mGlu3 (a), tubulin (b) and merged image (c). (d)–(f) Transfection of GRM3Δ4-V5, showing immunoreactivity for mGlu3Δ4 (d), tubulin (e) and merged image (f). (g)–(i) Co-transfection of GRM3 and GRM3Δ4-V5, showing immunoreactivity of mGlu3 (g), tubulin (h) and merged image (i). DAPI staining (blue) is shown in (c), (f) and (i). Bar: 10µm (note different magnification in (d)–(f)).

