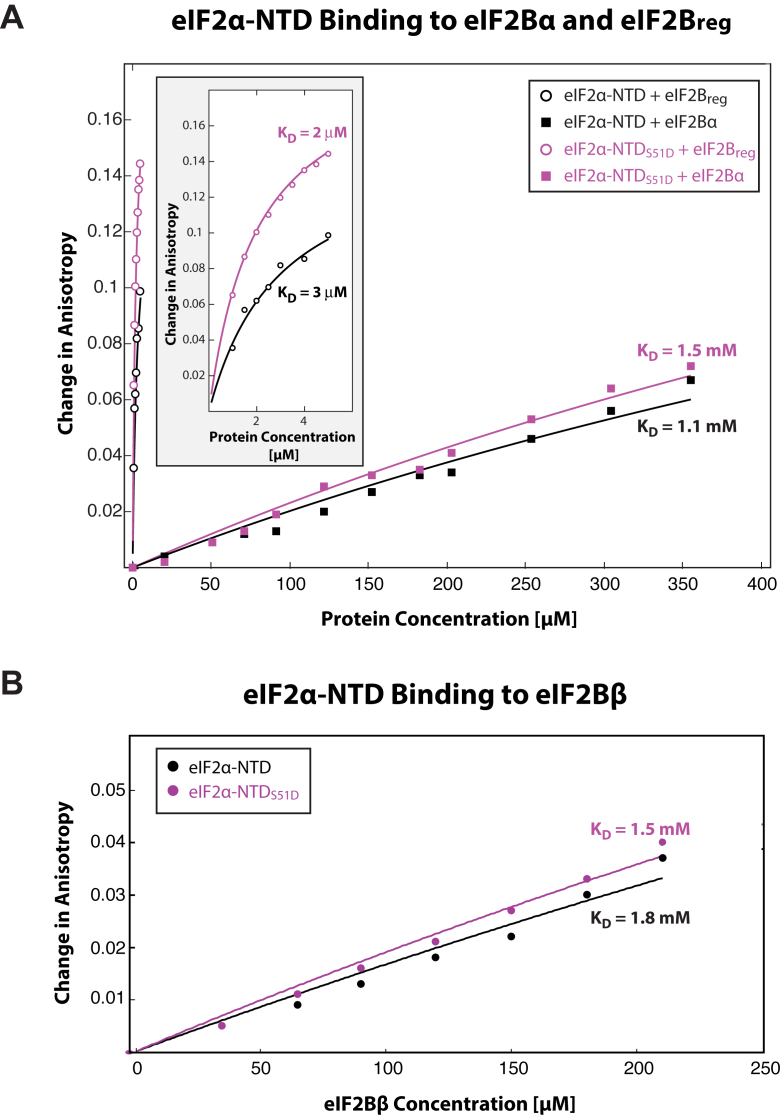
Figure 5.
eIF2Bα, eIF2Bβ, and eIF2Breg bind eIF2α-NTD and eIF2α-NTDS51D with similar affinities. Plot of the changes in fluorescence anisotropy of fluorescein-labeled eIF2α-NTD (black) and eIF2α-NTDS51D (purple) in the presence of increasing concentrations of unlabeled eIF2Bα (solid squares) and eIF2Breg (circles) (A), and eIF2Bβ (B). Calculated KDs are shown next to the corresponding titration curves. Zoomed-in eIF2Breg titration curves are shown in the inset of panel A. No substantive difference in affinity was observed for eIF2Bα, eIF2Bβ, or eIF2Breg as a function of the phosphorylation state of eIF2α-NTD.

