Figure 4.
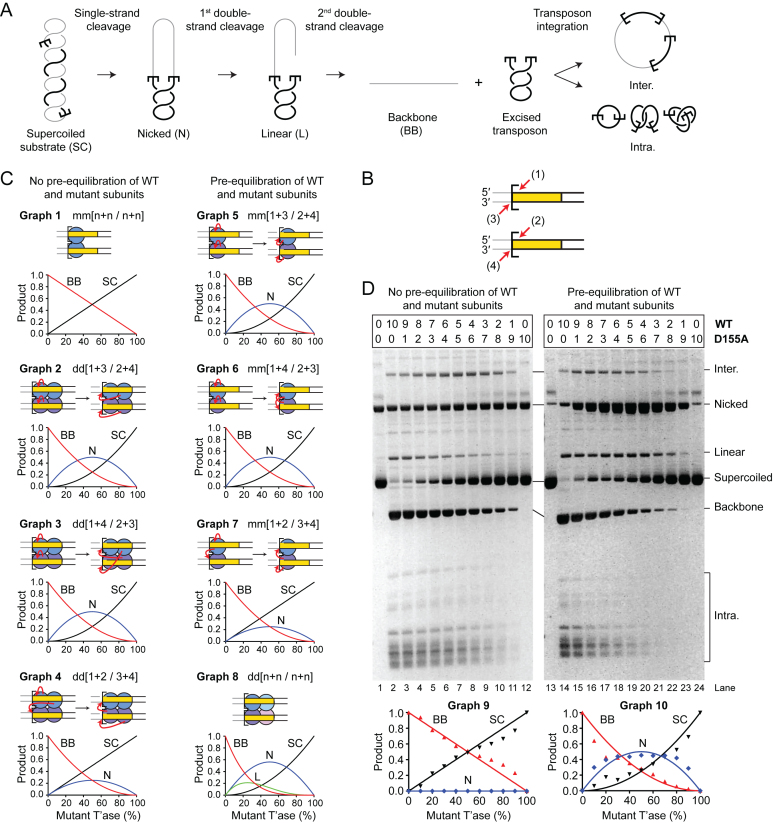
A single transposase dimer performs all the catalytic steps of transposition. (A) An illustration of the plasmid transposition assay. (B) The four DNA strand cleavages. Nicks 1 and 2, and nicks 3 and 4 are indistinguishable from each other because of the rotational symmetry of the complex. Note that the order of strand cleavages appears to be a kinetic constraint rather than an absolute mechanistic constraint. See also Supplementary Figure S2. (C) Simulations of transposase mixing reactions. The different models for the roles of individual subunits during cleavage are illustrated, together with graphs predicting the outcomes of transposition reactions with various amounts of WT and catalytically inactive transposases. When the cleaved strand is given as ‘n’ it indicates that all models predict the same outcome irrespective of which subunit cleaves which strand. Two scenarios are considered: (left panel) reaction mixtures contain only WT and mutant homodimers; (right panel) reaction mixtures contain statistical distributions of WT and mutant homodimers and heterodimers. The predicted outcomes were calculated for models involving two transposase active sites (one dimer) or four transposase active sites (two dimers). A similar strategy was previously used to determine the role of individual subunits in the phage Mu and Tn10 transpososomes (8,55). See also Supplementary Figures S3 and 4. (D) Transposition reactions with mixtures of WT and catalytically inactive (D155A) transposases. In the left panel, transposase dimers were not allowed to redistribute prior to the reaction, which therefore contain essentially homodimers only. In the right panel, transposase dimers were allowed to redistribute prior to the reaction, which therefore contained homodimers and heterodimers. Photographs of ethidium bromide agarose gels are shown. The bands of the intermediates and products of transposon excision (SC, N, L and BB) were quantified and plotted (bottom panels). Plots display the experimental results (dots) and the predicted outcome of the two active sites models m/m[1+3/2+4] or m/m[1+4/2+3] (lines), which best fits the data. Note that the contaminating nicked substrate does not contribute significantly to the reaction because it reacts much more slowly than the supercoiled substrate (29). Numbers given above the gel lanes are transposase ratios. The lack of catalytic activity of the Hsmar1-D155A transposase is evident from a comparison of the plasmid preps (lanes 1 and 13) with reactions that contained only the mutant transposase (lanes 12 and 24).

