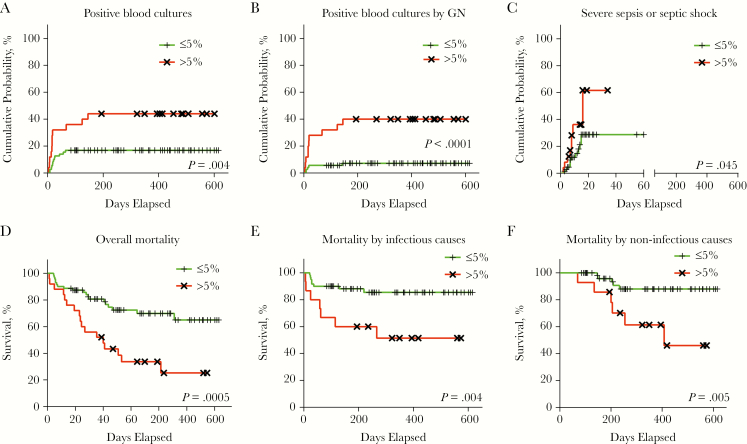
Figure 3.
Enterobacteriaceae 5% cutoff at T0 for different clinical outcomes (log rank test). Within the studied cohort, 25 (26%) patients featured >5% Enterobacteriaceae at T0, with 8 (8.33%) of them also displaying ≤10% Lachnospiraceae. (A) Cumulative probability for all cases of microbiologically confirmed sepsis (ie, positive blood cultures by both gram-negative and gram-positive enteric pathogens). (B) Cumulative probability curves for microbiologically confirmed sepsis by gram-negative enteric pathogens. (C) Cumulative probability curves for severe sepsis or septic shock. (D) Kaplan-Meier overall mortality curves. (E) Kaplan-Meier curves for transplant-related mortality by infectious causes. (F) Kaplan-Meier curves for transplant-related mortality by noninfectious causes. Abbreviation: GN, gram-negative.

