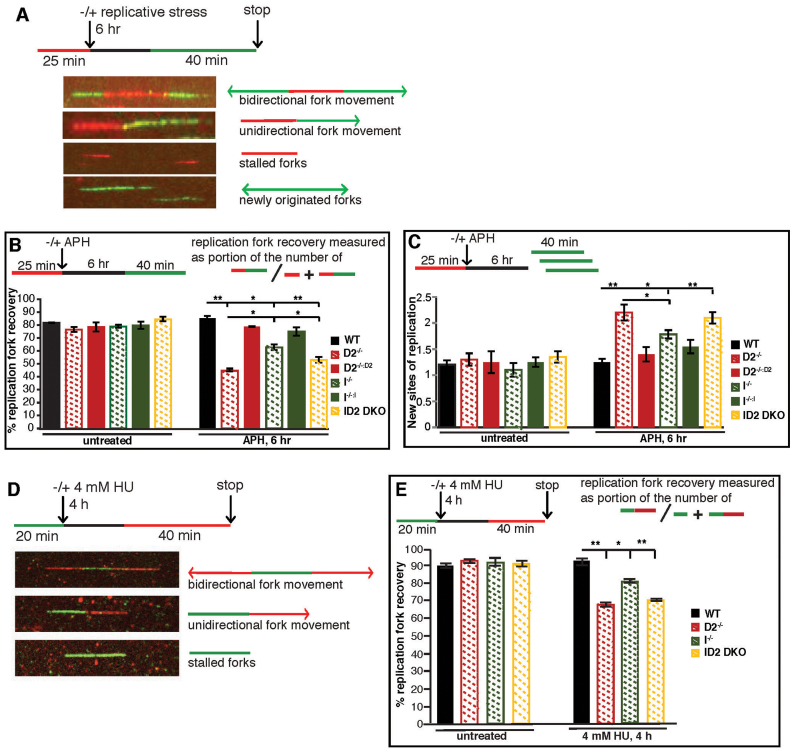
Figure 6.
FANCD2 plays a more crucial role than FANCI to promote replication fork recovery. (A) Schematic of the replication fork restart protocol with representative images of DNA fibers. Red tracks: DigU; green tracks: BioU. (B) FANCD2 plays a more crucial role than FANCI in promoting the restart of APH-stalled replication forks. The efficiency of replication restart in WT, D2−/− (clone #39), I−/− (clone #28), and ID2 DKO (clone #1), as well as in the complemented cells was measured as the number of restarted replication forks after APH (30 μM) mediated fork stalling (DigU-BioU tracts), compared with the total number of DigU-labeled tracts (DigU plus DigU-BioU). Statistical significance at P < 0.05, P < 0.01 and P < 0.001 are indicated as *, **, ***, respectively. (C) FANCD2 plays a more crucial role than FANCI in suppressing new origin firing in the presence of stalled replication forks. WT, D2−/− (clone #39), I−/− (clone #28), and ID2 DKO (clone #1), as well as the complemented cells were analyzed for the fraction of newly fired replication origins during the 40 min post-APH recovery period. Fractions were measured as the number of green-only (BioU) tracts compared with the total number of spreading replication tracts (BioU plus DigU-BioU). Statistical significance at P < 0.05, P < 0.01 and P < 0.001 are indicated as *, **, ***, respectively. (D) Schematic of the DNA combing assay with representative images of stretched DNA fibers. Green tracks: CldU; red tracks: IdU. (E) FANCD2 plays a more crucial role than FANCI in promoting the restart of HU-stalled replication forks. The efficiency of replication restart in WT, D2−/−(clones #29 and #39), I−/− (clones #28 and #30) and ID2 DKO (clones #1 and #2) was measured as the number of restarted replication forks after HU-mediated fork stalling (CldU-IdU tracts), compared with the total number of CldU-labeled tracts (CldU plus CldU-IdU). Data points were averaged between clones of identical genetic backgrounds. Statistical significance at P < 0.05, P < 0.01 and P < 0.001 are indicated as *, **, ***, respectively.

