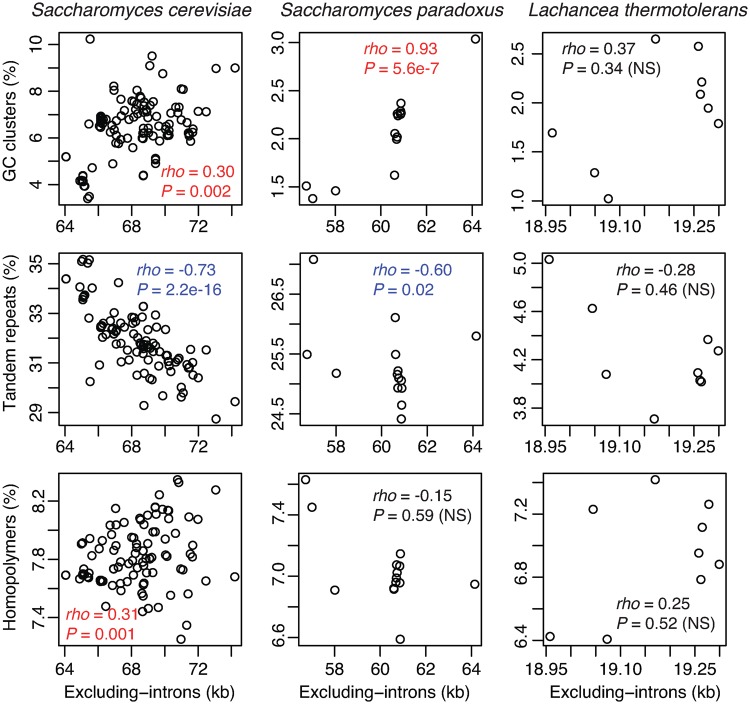
Fig. 5.
—Scatter plots of modified genome size against the proportion of GC-clusters, tandem-, and homopolymer (HP)-repeats among conspecific mitogenomes in Saccharomyces cerevisiae, Saccharomyces paradoxus, and Lachancea thermotolerans, respectively. Genome sizes after excluding introns are shown as “Excluding-introns.” Significant correlations are colored, that is, positive in red and negative in blue.

