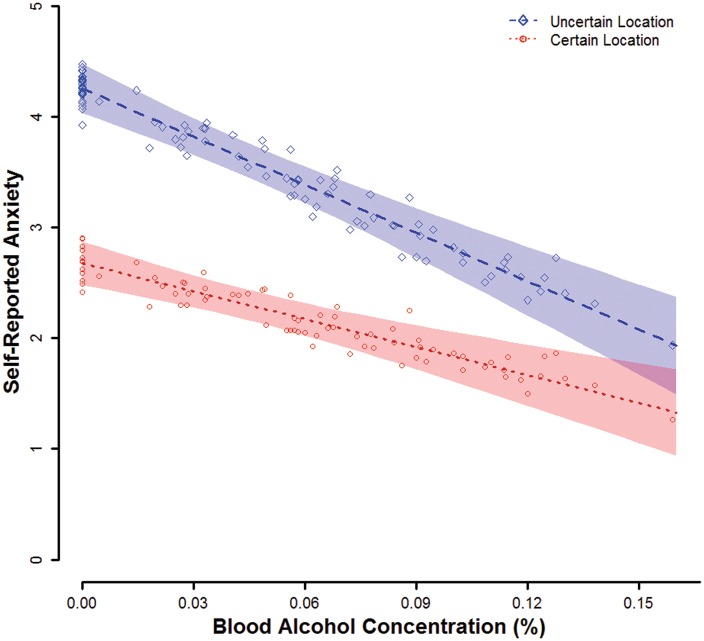
Fig. 3.
Self-reported anxiety by mean BAC and threat type. Lines display point estimates for mean self-reported anxiety by BAC and threat type from the general linear model. Translucent bands indicate confidence envelopes (±1 SE) for these point estimates. Points represent participants’ self-reported anxiety residual scores relative to their predicted values and scaled by the square root of N to allow display on the same scale as the population mean point estimates. Figure © 2017 John Curtin, Daniel Bradford, Courtney Motschman, and Mark Starr under Creative Commons Attribution 4.0 International Public License CC-By.

