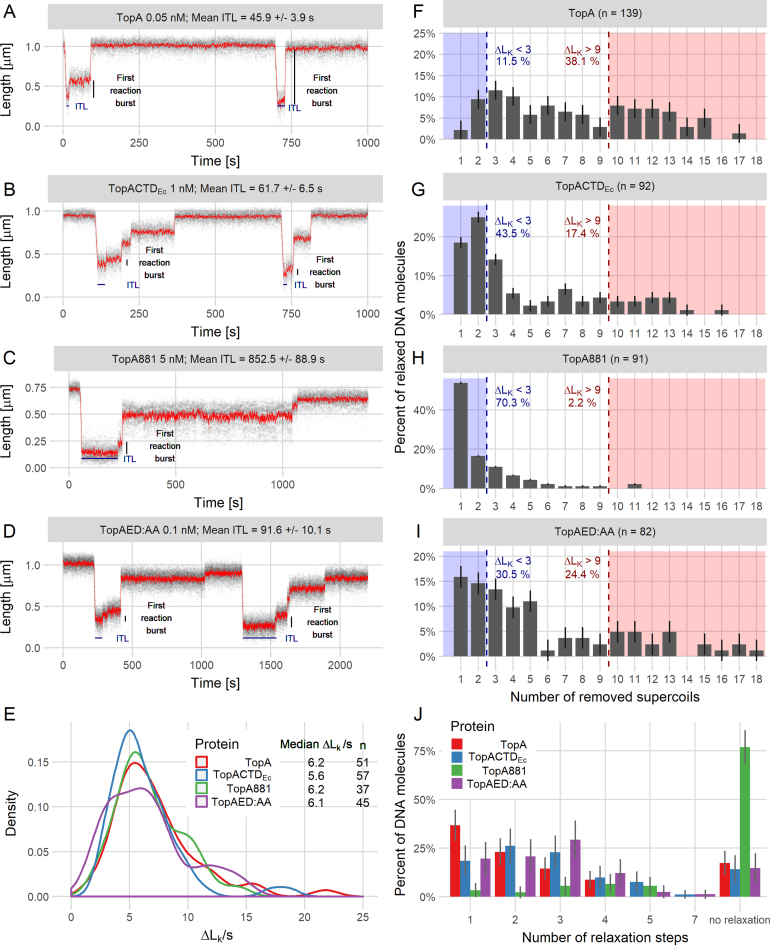
Figure 4.
Single-molecule analysis shows that modifications of the C-terminal domain decrease the processivity of TopA. (A–D) Example trace lines from single-molecule experiments for TopA (A) and the modified TopA versions TopACTDEc (B), TopA881 (C) and TopAED:AA (D) with the ITL and first reaction burst marked. (E) The supercoil relaxation rates (ΔLk/s) for TopA (red), TopACTDEc (blue), TopA881 (green) and TopAED:AA (purple). The plot shows the distribution as a probability density function. n is the number of analyzed events, in which between 6 and 12 supercoils were removed from the DNA molecule. (F–I) Decreased processivity of the modified proteins TopACTDEc (G), TopA881 (H), and TopAED:AA (I) compared to the wild-type TopA (F), calculated as the number of supercoils removed—ΔLk (change in the linking number) during the first relaxation burst. Dashed lines indicate the fraction of the molecules in which fewer than three (blue) or more than nine supercoils (red) were removed. ‘n’ is the total number of relaxation events analyzed for each protein. (J) The increased number of steps required by TopA (red), TopACTDEc (blue), TopA881 (green) and TopAED:AA (purple) for the full relaxation of 5-kb DNA molecules. The histogram shows the percentage of the non-relaxed DNA molecules and the DNA molecules that were relaxed in the specified number of steps (1–7) for each tested protein.

