Figure 5.
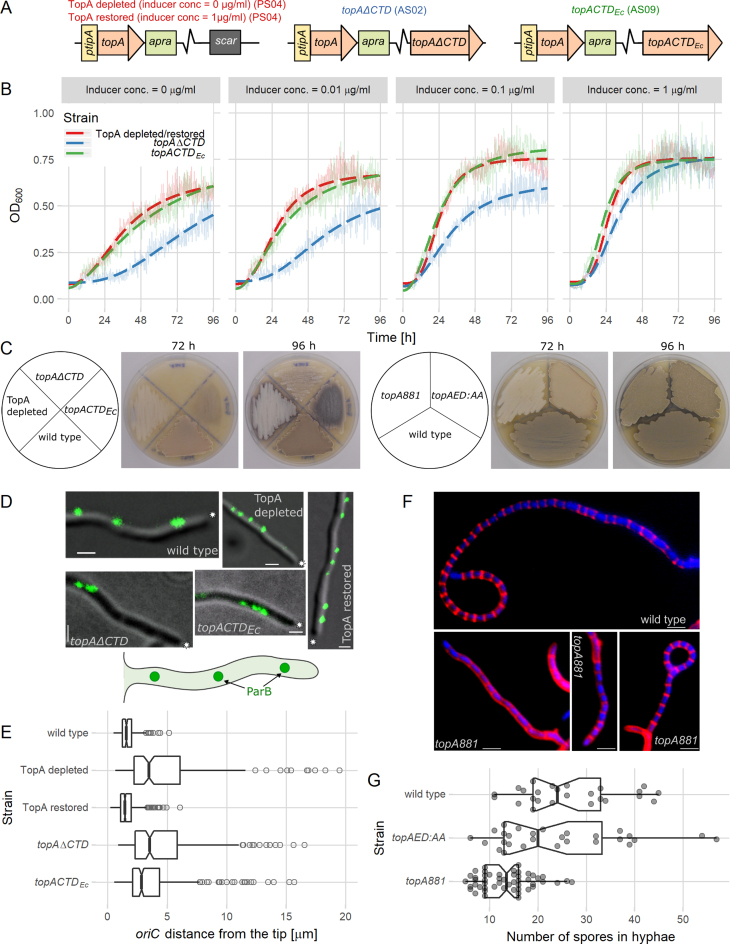
C-terminal TopA domain modifications impair S. coelicolor growth and development. (A) Scheme of the strains used in the in vivo experiments: PS04 (TopA depleted), AS02 (topAΔCTD) and AS09 (topACTDEc). (B) Inhibited growth of TopA-depleted (PS04, red), topAΔCTD (AS02, blue) and topACTDEc (AS09, green) strains cultured with different concentrations of wild-type topA expression inducer (0–1 μg/ml) compared to TopA-restored strain (PS04, inducer concentration 1 μg/ml). Semitransparent lines show the mean absorbance values obtained from five replicates, and the dashed lines correspond to the fit to a log-logistic growth model. (C) Slower development TopA-depleted (PS04), topAΔCTD (AS02), topACTDEc (AS09), topA881 (AS03) and topAED:AA (AS05) strains compared to the wild-type (M145) at 72 and 96 h of growth on SFM medium. Gray pigment is characteristic of fully developed aerial hyphae and white color indicates the inhibition of S. coelicolor sporulation (the dark appearance of AS09 results from the production of blue actinorhodin). (D) Disturbed positions of chromosomal oriC regions in hyphae of wild-type (AK101), TopA-depleted (AS11, with and without the presence of the inducer of TopA expression), topAΔCTD (AS12) and topACTDEc (AS19) strains. Images show ParB-EGFP fluorescence (green) overlaid with a DIC image (gray). Scale bar 1 μm, asterisks indicate the tips of hyphae, and the cartoon represents the imaged hyphae. (E) Increased distance between the hyphal tip and the apical chromosome oriC in the TopA-depleted (AS11, 202 hyphae analyzed), TopA-restored (AS11 cultured in the presence of inducer, 578 hyphae analyzed), topAΔCTD (AS12, 296 hyphae analyzed) and topACTDEc (AS19, 312 hyphae analyzed)) strains compared to the wild-type (AK101, 202 hyphae analyzed). Boxplots show the median of distribution (line), the first and third quartiles (lower and upper ‘hinges’), and the 95% confidence interval (notches around the median). (F) Prespore chains of normal length in wild-type (M145) and examples of shortened prespore chains in topA881 (AS03) strains. Images show hyphae (after 44 h of culture); cell walls were stained with Texas Red (red), and the DNA was stained with DAPI (blue). Scale bar 2 μm. (G) The number of compartments in prespore chains of the wild-type (M145, 25 hyphae analyzed), topAED:AA (AS05, 28 hyphae analyzed) and topA881 (AS03, 50 hyphae analyzed) strains. Boxplots show the median of distribution (line), first and third quartiles (lower and upper ‘hinges’), and the 95% confidence interval (notches around the median). Semitransparent points indicate all observations.

