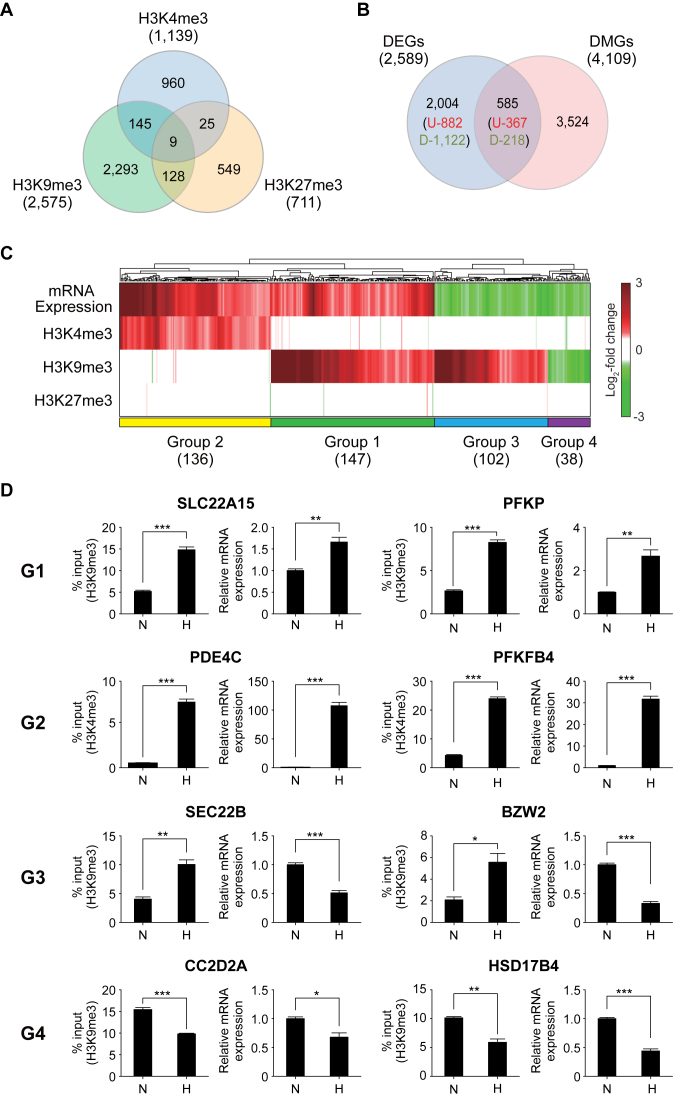
Figure 4.
Relationships between changes of histone methylation and mRNA expression in hypoxia. (A) Relationships of the DMGs identified for H3K4me3, H3K9me3 and H3K27me3. The numbers in parentheses denote total numbers of DMGs identified for individual histone methylations. (B) Comparison of the DMGs and DEGs. The numbers of up- and down-regulated genes were also shown in parenthesis. (C) Four major groups (Groups 1–4) of the shared genes between the DMGs and DEGs. A heat map was generated by a hierarchical clustering of log2-fold-changes of gene expression and histone methylation levels (RPKMs) using Euclidean distance and the average linkage method. Colors in the heat map represent up- (red) and down-regulation (green) in hypoxia, compared to normoxia. Color bar shows the gradient of log2-fold-changes of gene expression and histone methylation levels. The number of the genes in each group was shown in parenthesis. (D) ChIP-PCR and RT-PCR analyses of the representative genes in Groups 1–4 confirming the differential methylation and expression in the groups. The graph shows two or more replicates with SEM. *P < 0.05, **P<0.01 and ***P < 0.001 by Students’ t-test.

