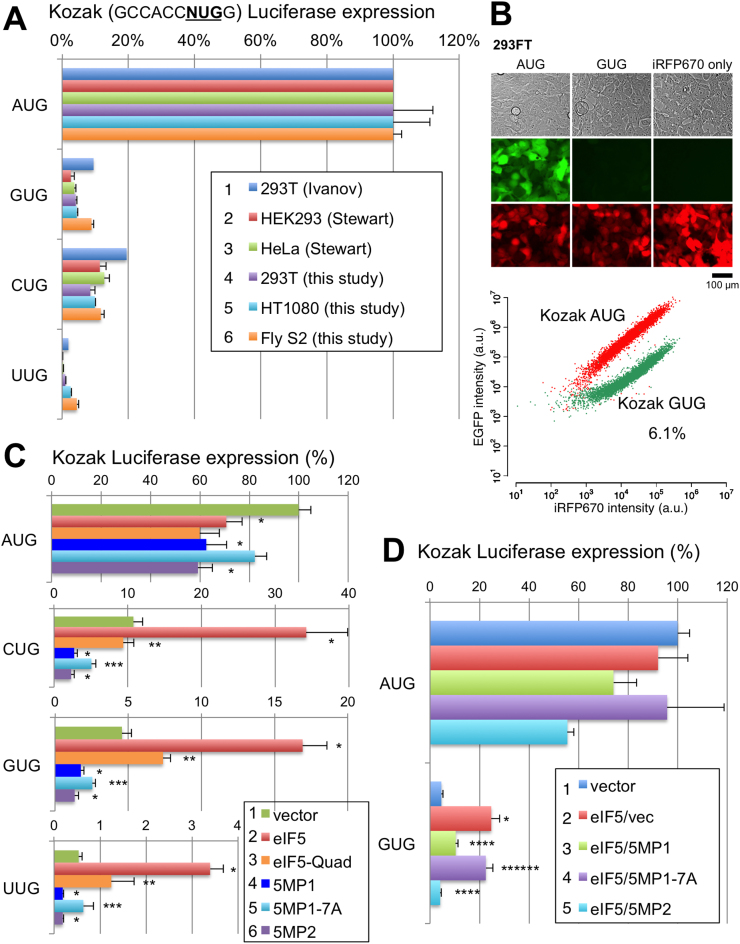
Figure 2.
5MP1 and eIF5 conversely regulate non-AUG initiation in human cells. (A) Spectrum of non-AUG initiation rate in various cells. HEK293T, HT1080 (fibrosarcoma), and fly S2 cells were transfected with firefly luciferase reporter plasmids (Supplementary Table S1) initiated by indicated start codons and a control Renilla luciferase plasmid and assayed for both the luciferase activities (see Supplemental method). Firefly/Renilla expression ratio was presented relative to the value from the AUG firefly luciferase reporter. Data was compared to values from different cells determined previously (53,54). (B) mRNA transfection assay. GFP mRNA with an altered initiation site was co-transfected with iRFP670 mRNA in 293FT cells and 10,000 transfected cells were analyzed by FACS. Pictures of cells taken under visible light or green or red fluorescence are shown. Graph, GFP and iRFP signals from each cell were plotted for control GFP mRNA (red) and GFP mRNA with a GUG start codon (green). The value indicates the percentage of GUG initiation compared to control AUG initiation. (C) Effect of eIF5 and 5MP on non-AUG initiation. HEK293T was transfected with the indicated NUG reporter plasmid, Renilla control plasmid, and pEF1A derivatives expressing indicated proteins (5:1 compared to firefly plasmid), assayed for luciferase activities and presented as in panel (B). Asterisks denote statistical significance (P < 0.05) compared to vector control (*), eIF5 (**) or 5MP1 (***) experiments. P values from top of each graph; AUG, 0.01, 0.001 (n = 6), 0.007 (n = 4),; CUG, * 0.02 (n = 4), 0.0001 (n = 8), 0.03 (n = 4), ** 0.016 (n = 4), *** 0.02 (n = 4); GUG, * 0.008 (n = 4), 0.006 (n = 12), 0.018 (n = 6), ** 0.031 (n = 4), *** 0.018 (n = 4); UUG, * 0.00006 (n = 6), 0.01, 0.017 (n = 6), ** 0.007 (n = 6), *** 0.04 (n = 4). (D) Effect of co-expression of eIF5 and 5MP on GUG versus AUG initiation. Assays were done and presented as in panel (C) except using two expression plasmids (1:1) together, as indicated in the inset. P values from top of graph GUG; * 0.0008 (n = 8) compared to row 1, ****0.002 (n = 10), 0.009 (n = 4), compared to row 2; *****0.03 (n = 6) compared to row 3.

