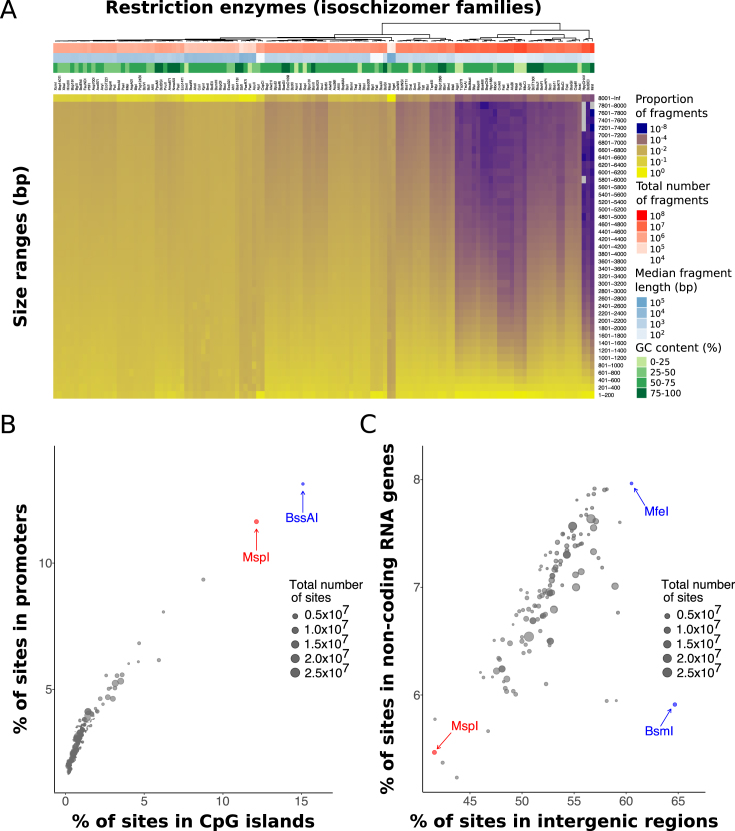
Figure 1.
Restriction enzyme digestion as a tool for genomic enrichment. (A) Heatmap showing the fragment length distributions generated by different restriction enzymes in the human genome (hg38). Each column represents the distribution for an isoschizomer family of restriction enzymes that contains at least one member which is methylation-insensitive in a CpG context. The distributions are binned in size ranges of 200 bp, ordered as they would appear in an electrophoretic gel. Additional row annotations on top of the heatmap contain information regarding the total number of fragments (in red) and the median fragment length (in blue) produced by each in silico digestion, together with the GC content of the recognition motif in the isoschizomer family (in green). Legend is displayed on the right hand side. (B) Scatterplot showing the percentage of cleavage sites from different restriction enzymes that overlaps with CpG islands (X-axis) and promoters (Y-axis) in the human genome (hg38). The size of the circles represents the total number of cleavage sites generated by each enzyme. The enzymes MspI and BssAI are highlighted in red and blue respectively. Legend is displayed on the right hand side. (C) Scatterplot showing the percentage of cleavage sites from different restriction enzymes that overlap with intergenic regions (X-axis) and non-coding RNA genes (Y-axis) in the human genome (hg38). The size of the circles represent the total number of cleavage sites generated by each enzyme. The enzyme MspI is highlighted in red. The enzymes BsmI and MfeI are both highlighted in blue. Legend is displayed on the right hand side.

