Figure 2.
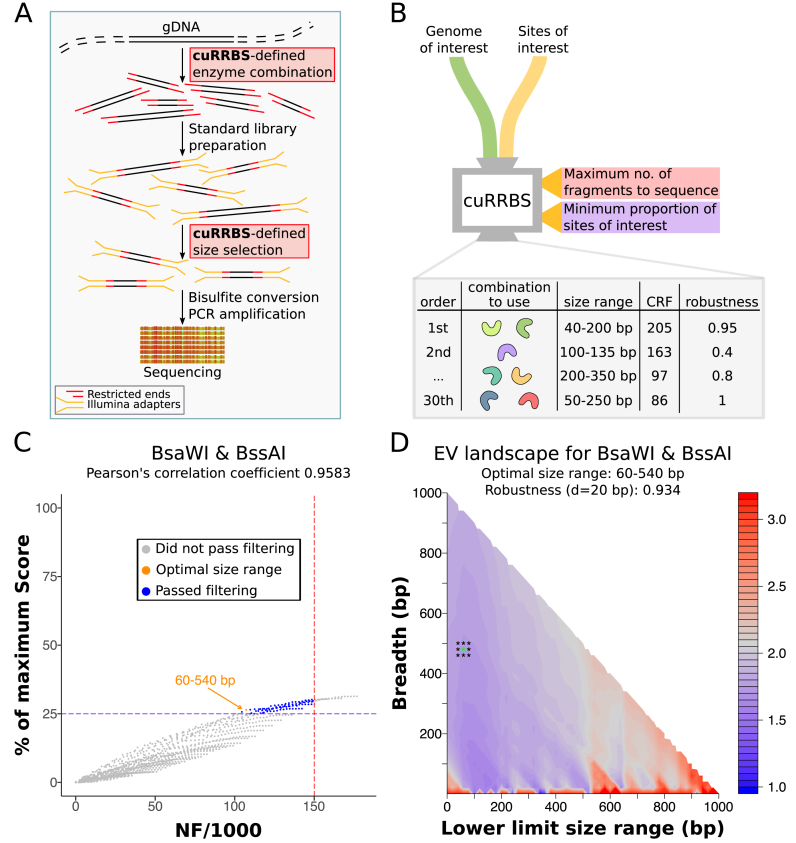
cuRRBS overview. (A) Outline of an RRBS protocol. Highlighted are the two steps that would be modified according to the output produced by cuRRBS (i.e. the restriction enzymes used for the genomic digestion and the size selection). Legend is displayed on the bottom left. (B) Schematic of cuRRBS. Highlighted are the two main inputs required for the software and the two thresholds that the user has to define (red and purple tags). The default output for cuRRBS is a table containing the top hits (restriction enzyme combination and size range) along with additional information that might be useful to the user (such as Cost Reduction Factor and robustness). (C) Scatterplot showing the trade-off between the number of fragments (NF) and the Score for the best enzyme combination (BsaWI & BssAI) that targets the CpGs present in the human placental-specific imprinted regions (35). NF is divided by 1000 for visualization purposes. Each point represents a different size range. Shown in dark blue and grey are the size ranges that would and would not pass filtering respectively. Shown in orange is the optimal size range in the filtered search space. The dotted lines depict the thresholds that need to be specified by the user (red: maximum NF; purple: minimum percentage of the maximum Score). In this mock example we specified an NF threshold of 150 000 fragments and a Score threshold of 25% of the maximum Score. Legend is displayed below the plot title. (D) Contour plot that depicts how the robustness (R) variable is calculated for the optimal enzyme combination (BsaWI & BssAI; size range: 60–540 bp) that targets the CpGs present in the human placental-specific imprinted regions (35). Enrichment values (EVs) are calculated for all possible size ranges in order to create an ‘EV landscape’. In this landscape, cuRRBS finds the size range with the lowest EV that still satisfies the thresholds (asterisk in green). Afterwards, cuRRBS samples EVs around the optimum (asterisks in black). The points that are sampled depend on the experimental error (in this case, δ = 20 bp). A high robustness value means that the sampled EVs do not change a lot when compared to the optimum, which implies that cuRRBS prediction will not be greatly affected by experimental errors during the size selection step.

