Figure 3.
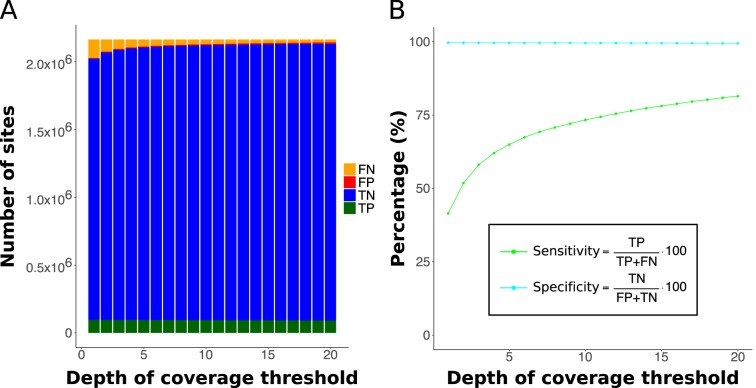
Experimental validation of cuRRBS. (A) Barplots showing the number of true positives (TP, in green), true negatives (TN, in blue), false positives (FP, in red) and false negatives (FN, in orange) when comparing cuRRBS theoretical prediction with the actual XmaI-RRBS experimental data (30). The number of sites in each category is calculated for different thresholds in the depth of coverage (number of reads covering a CpG site as reported by Bismark). cuRRBS prediction for the CpG sites in human CpG islands was obtained enforcing a theoretical size range of 90–185 bp and running the software for XmaI with all the default parameters (with a read length of 200 bp). Legend is displayed on the right hand side. (B) Plot showing values of cuRRBS sensitivity (in light green) and specificity (in cyan) as a function of the depth of coverage threshold employed to filter the experimental data (30). The number of true positives (TP), true negatives (TN), false positives (FP) and false negatives (FN) are the same as in A. Legend is displayed below the plot curves.

