Fig. 1.
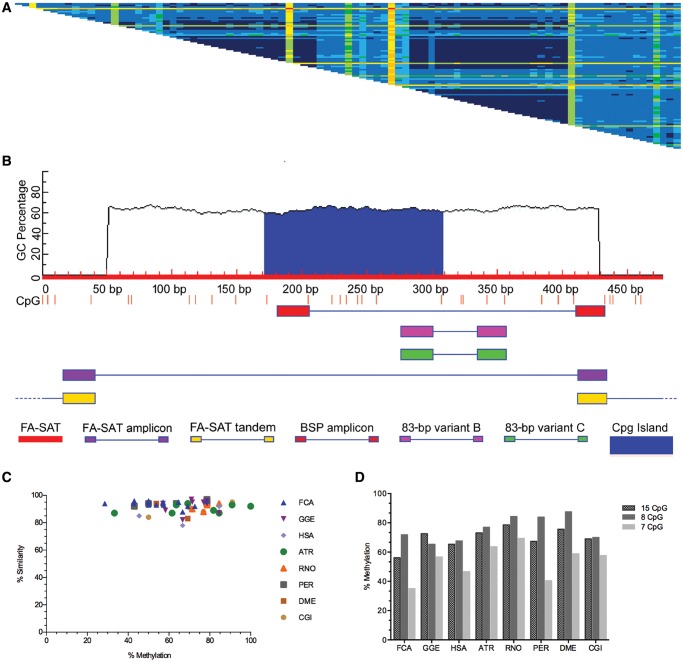
—FA-SAT-related sequence identity and methylation status profile (A) Distance matrix of pairwise alignments of FA-SAT clones from all of the studied species. The distances were calculated using the alignment algorithm CLUSTALW, and the matrix was generated by Geneious R9 version 9.1.2 (Biomatters) under default settings. Cells showing nucleotide identities of P98–100% (dark blue), 94–97.9% (medium blue), 90–93.9% (light blue), 88–89.9% (dark green), 84.1–87.9% (light green), 80–84% (yellow), 70–80% (orange), and <70% (red). The same matrices containing the identity values in the cells are shown in supplementary figure S3 in the Supplementary Material online. (B) CpG profile (CpG sites as red bars) of the FA-SAT monomer in red (GenBank, sequence accession number: X06372.1), highlighting the CpG island in blue. Also shown are the primers (supplementary table S1, Supplementary Material online, for sequence) used and their respective amplicon locations. These include primers for FA-SAT monomer isolation (FA-SAT, in purple), bisulfite sequence (BSP, in red), 83-bp variant B (in pink), and 83-bp variant C (in green). The scheme presented was adapted from the output of MethPrimer (Li and Dahiya 2002) for CpG island prediction (C) Graphical view showing the similarity and variation of the DNA methylation status of FA-SAT bisulfite-related sequence clones for FCA, GGE, HSA, ATR, RNO, PER, DME, and CGI genomes given by the methylation percentage of all the CpG sites in each BSP clone compared with the FA-SAT monomer BSP predicted sequence. (D) Graphical representation of the methylation percentages of the different FA-SAT-related bisulfite clones for the species indicated in (C) regarding the total 15 CpG sites analysed, the 8 CpG island sites, and the remaining 7 CpG sites.

