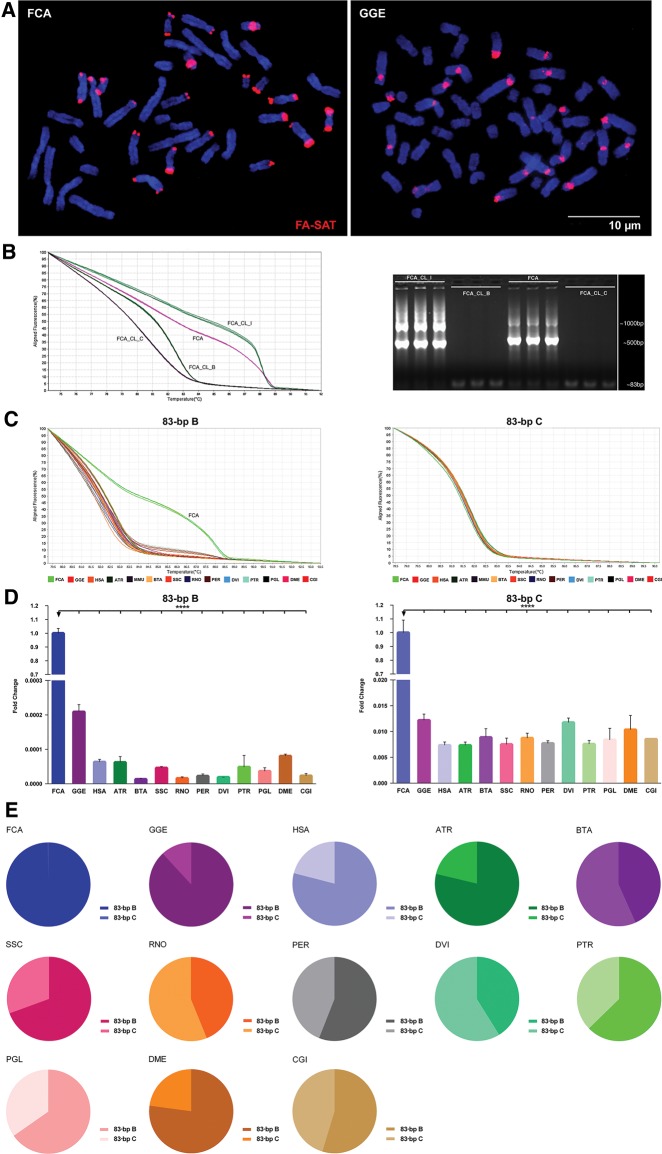
Fig. 2.
—FA-SAT DNA profile overview in different Bilateria genomes (A) Physical mapping of FA-SAT DNA by in situ hybridization (red) onto FCA and GGE chromosomes (blue). Scale bar represents 10 µm. (B) High-resolution melting (HRM) analysis of clones FCA_CL_I, FCA_CL_B, and FCA_CL_C and genomic DNA from FCA and respective FA-SAT 83-bp amplicons by agarose gel electrophoresis. (C) HRM analysis of FA-SAT 83-bp variants B and C in genomes of FCA, GGE, HSA ATR, MMU, BTA, SSC, RNO, PER, DVI, PTR, PGL, DME, and CGI. (D) FA-SAT copy number fold change of variants B and C in the different analysed genomes indicated, considering FCA as the reference genome. (E) Representativeness of each FA-SAT variant (B and C) in each of the different analysed genomes. Data are presented as mean ± SD of three replicates. *P ≤ 0.05, **P ≤ 0.01, ***P ≤ 0.001, ****P ≤ 0.0001 as determined by the Student’s t-test (two-tailed) when two samples were compared and by one-way ANOVA when more than two samples are analysed.

