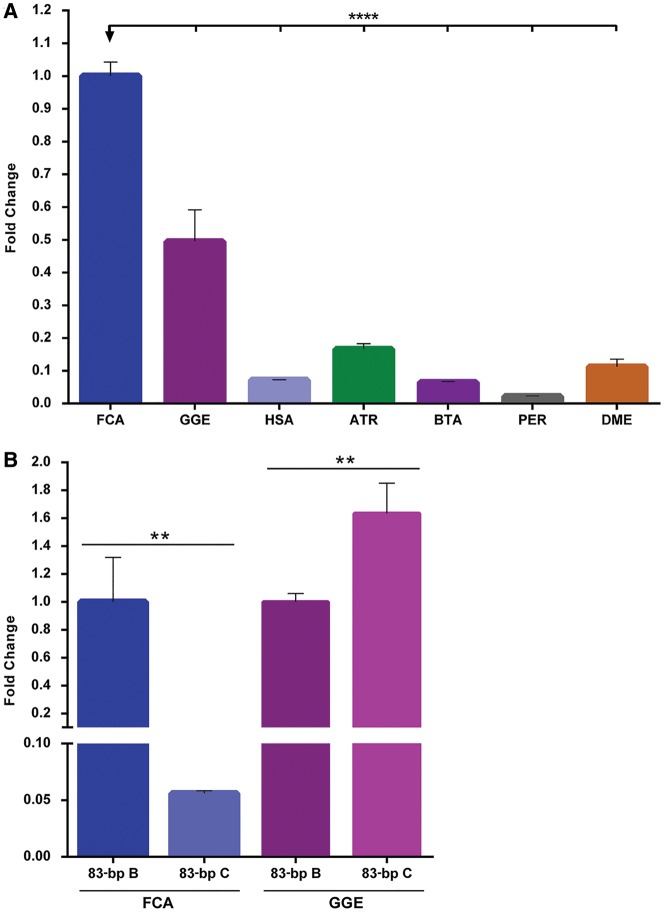
Fig. 4.
—FA-SAT transcription in Bilateria genomes (A) Relative quantification of FA-SAT transcripts in different Bilateria genomes (FCA, GGE, HAS, ATR, BTA, PER, and DME). (B) FA-SAT transcription fold change of variants B and C in each of the Carnivora genomes, FCA and GGE, considering variant B as the reference. Data are presented as the means ± SD of three replicates. **P ≤ 0.01 ****P ≤ 0.0001 as determined by one-way ANOVA.

