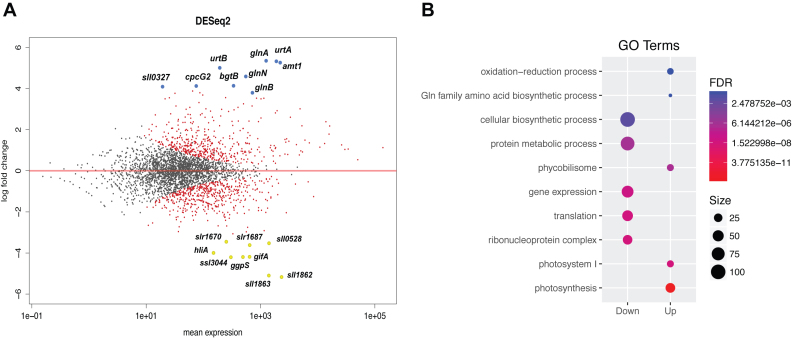
Figure 2.
Global response to nitrogen starvation in Synechocystis sp. PCC 6803. (A) MA plot: a scatterplot of log2-fold-change (−N/NH4) versus average expression in log2 scale for each gene, produced using the DEseq2 package. Dots shown in red indicate differentially expressed genes with adj. P-value of < 0.1. The nine genes with the highest induction and repression are shown in blue and yellow, respectively. (B) GO enrichment analysis of differentially expressed genes under nitrogen starvation conditions. Only GO of biological processes and cellular components having a false-discovery rate of <0.1 are shown.

