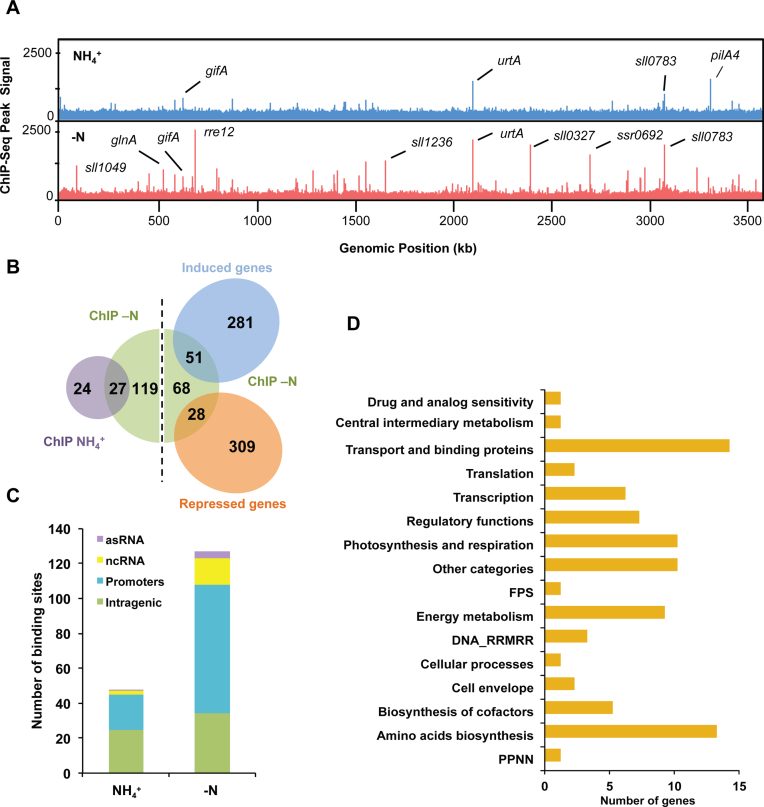
Figure 4.
Genome-wide NtcA DNA binding analysis. (A) NtcA binding across the genome was compared for NH4 (blue track) or −N (red track) conditions. The x-axis indicates the genomic position of the ChIP-seq peaks, while the y-axis indicates the read count after each dataset was normalized using BamCoverage (Ramirez, F. 2016). Names of genes assigned to peaks with high read count are also shown. B. Venn diagram showing overlap of genes with significant binding by NtcA in +NH4 versus −N conditions. Overlap of genes differentially expressed (P-value < 0.1 and fold change > 2) after nitrogen depletion versus genes with significant binding by NtcA are also shown. (C) Distribution of NtcA binding peaks for NH4 and −N conditions. NtcA peaks were classified into four categories: intragenic region (green), gene promoter (blue), ncRNA promoter (yellow) and antisense promoter (purple). (D) Genes with NtcA binding peaks assigned to NH4 or −N conditions, were grouped into functional categories according to the CyanoBase classification. FPS: Fatty acid, phospholipid and sterol metabolism; PPNN: Purines, pyrimidines, nucleosides and nucleotides; DNA_RRMRR: DNA replication, restriction, modification, recombination and repair.

