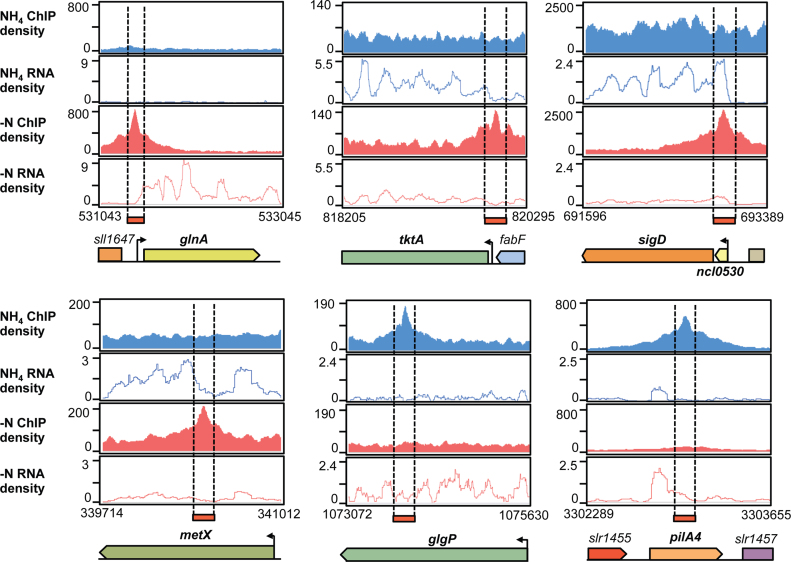
Figure 5.
Read coverage of potential NtcA targets detected by parallel differential profiling. The ChIP-seq and RNA-seq density profiles are shown in blue for NH4 and in red for −N treatments. Examples of genes included in the NtcA regulon are displayed: NtcA activated (glnA) or repressed (tktA) genes, long transcripts containing ncRNA and downstream protein-coding genes that are transcribed by read-through over the ncRNA terminator (ncl0530-sigD); and genes with internal peaks (metX, glgB and pilA4). Values on the x-axis are the genomic coordinates. Arrows indicate transcriptional start sites (TSS) obtained from Mitschke et al. (46).

