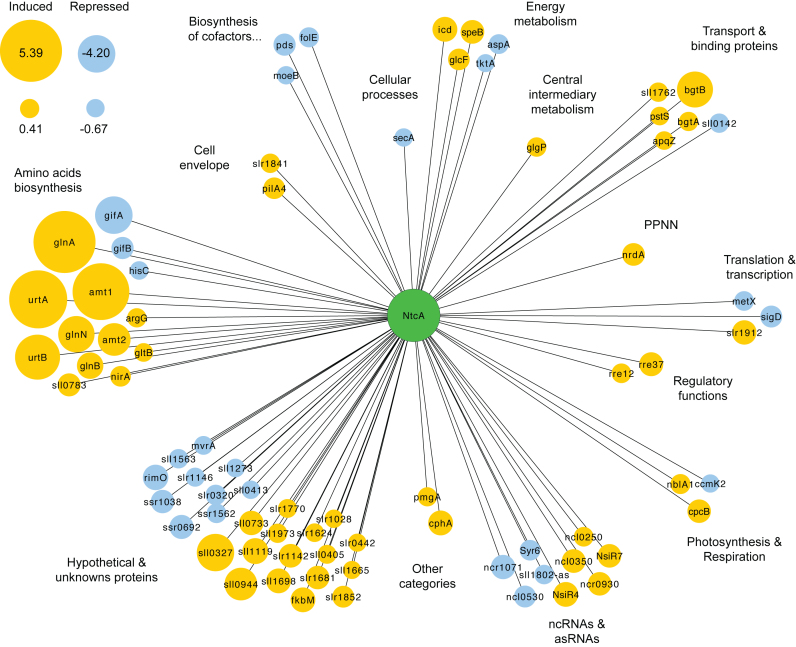
Figure 6.
NtcA regulatory network and its transcriptional dynamics for the early stages of nitrogen depletion. Target genes are represented by nodes that are colored based on gene expression after 4 h of nitrogen depletion: yellow for upregulated genes, and blue for downregulated genes. Node sizes correspond to the magnitudes of expression changes as a log2 expression ratio (−N/NH4). Genes are grouped according to the functional categories obtained from CyanoBase. PPNN: purines, pyrimidines, nucleosides and nucleotides.

