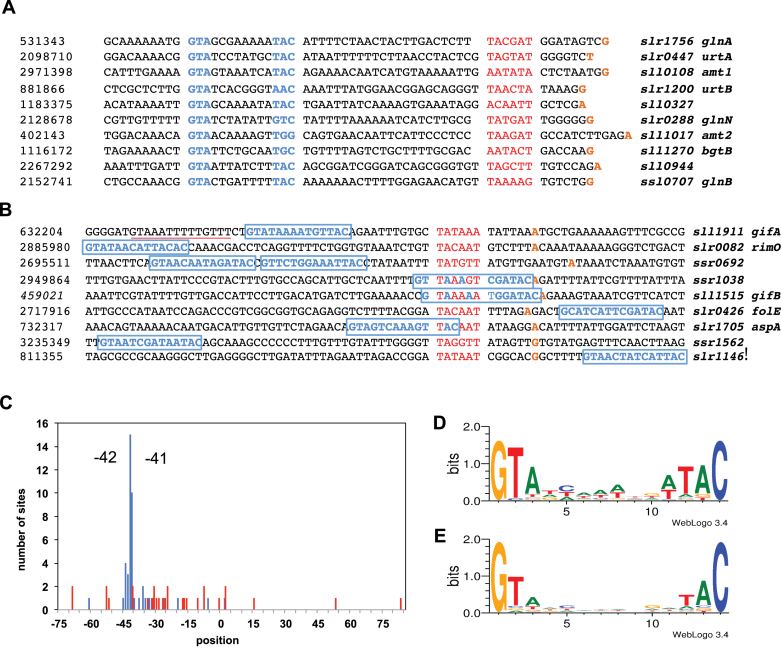
Figure 7.
Sequence analysis of NtcA binding sites. (A and B) Promoter regions having NtcA binding sites for ten most strongly induced and repressed genes, respectively. Nucleotides confirming the putative NtcA consensus-binding sequence are indicated in blue, potential −10 promotor elements in red and transcriptional start sites (TSS) in orange. An alternative NtcA binding site for the gifA promoter at position −45 is underlined in red. (C) Distribution of positions of NtcA binding sites identified for genes of the NtcA regulon. The location of NtcA binding was determined by matching the NtcA consensus sequence. The relative position was defined as the distance of the seventh nucleotide of a putative NtcA binding site to the TSS. Blue and red bars indicate the frequency of these positions for induced and repressed genes, respectively. (D) NtcA binding motif defined by target genes of the NtcA regulon. (E) Binding motif found using all the putative NtcA binding sites identified by ChIP-seq analysis. (Representation by WebLogo 3.0) (54).

