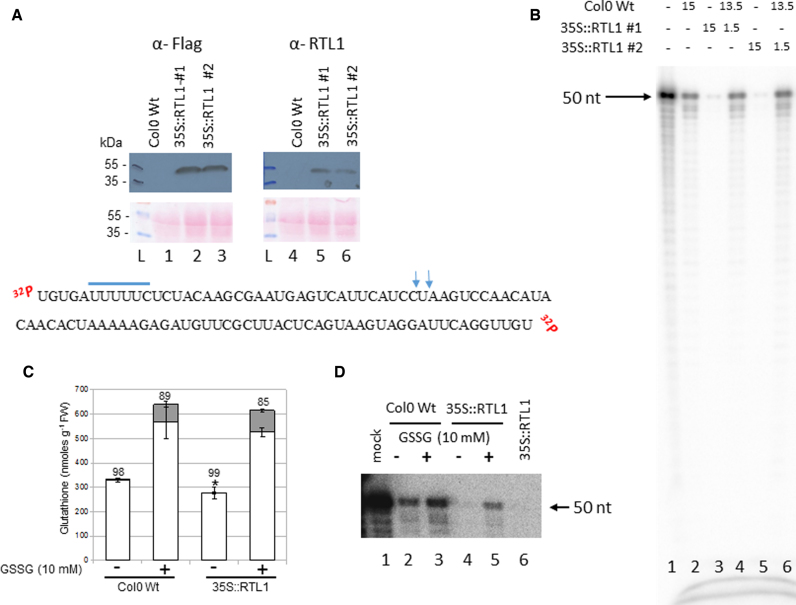
Figure 7.
Plant GSSG treatment affects RTL1 cleavage activity. (A) Top, proteins from Col0 WT and 35S::RTL1 (#1 and #2) plants were extracted and hybridized with α-Flag and α-RTL1 antibodies. Ponceau staining (pink dye) is shown as protein loading control (lanes 1–3 and 4–6). L, indicates protein ladder. Bottom, sequence of dsRNA substrate-2. The putative rcr motif is underlined and the vertical arrows show DCL3/DCL4 cleavage site. (B) [γ-32P]-ATP RNA substrate-2 was incubated with either WT (lanes 2), 35S:RTL1-Flag #1 (lane 3) or 35S:RTL1-Flag #2 (lane 5) protein extracts or with WT + 35S:RTL1-Flag #1 (lane 4) or WT + 35S:RTL1-Flag #2 (lane 6) protein extracts. Reactions were performed either with 15 μl, 1.5 μl or 15 μl + 1.5 μl. Lane 1 shows [γ-32P]-ATP RNA substrate-2 only. (C) Glutathione levels in 2-weeks old WT and 35S:RTL1-Flag #1 plantlets treated or not with 10 mM GSSG. Asterisks indicate a significant difference (P ≤ 0.01) between total glutathione levels of WT and 35S:RTL1 plants. Reduced and oxidized glutathione levels are indicated by white and gray bars, respectively. The percentage reduction state of glutathione is indicated above bars. Error bars represent SD (n = 4). (D) [γ-32P]-ATP RNA substrate-2 was incubated with WT and 35S:RTL1-Flag #1 protein extracts prepared from treated (lanes 3 and 5) or not (lanes 2 and 4) with 10 mM GSSG respectively. Lane 1, shows [γ-32P]-ATP RNA substrate-2 only and Lane 6, cleavage reaction using 35S:RTL1-Flag #1 protein extract not submitted to GSSG buffer and is used as a positive control.

