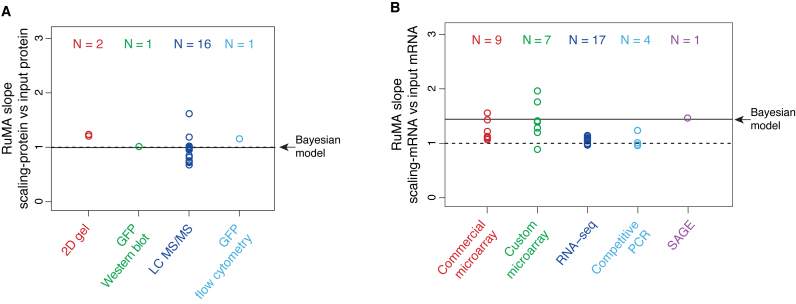
Figure 4.
The RuMA slope between scaling-standards and the datasets input to the Bayesian model. (A) Protein data. (B) mRNA data. Each data point is the mean of the RuMA slopes between a single input dataset versus each of the corresponding scaling-standards, where RuMA slope = standard deviation of a scaling-standard / standard deviation of an input dataset. The results are grouped by the method used to produce the input dataset, and the numbers of datasets in each group are indicated (N). An RuMA slope of 1 is shown by the dashed black line, the case where the standard deviation of the input dataset is equal to the mean of the standard deviation of the scaling-standards. The mean RuMA slope between the scaling-standards and the abundance estimates from the Bayesian model is shown by the solid black line.

