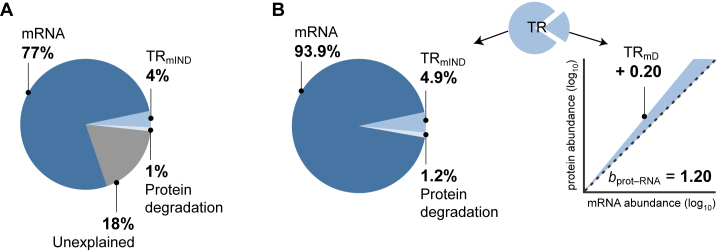
Figure 6.
Contributions to the control protein expression. (A) The maximum percentage contributions of estimates of mRNA abundance, protein degradation (PnD), and TRmIND to the variance in measured levels of protein expression as well as the percent of the variance unexplained (Supplementary Tables S4 and S6). The contributions were calculated by using the OLS regression to fit a statistical model (Materials and Methods, Equation 12). (B) Left, the presumed percentage contributions of true mRNA abundance, protein degradation (PnD) and TRmIND if the unexplained component in A is due to similar proportions of measurement error in each data class. Right, the mean of our estimates for the contribution of TRmD to the amplification exponent bprot–RNA. The dashed black line shows a slope of 1, the shaded area shows the increase in slope due to TRmD.

