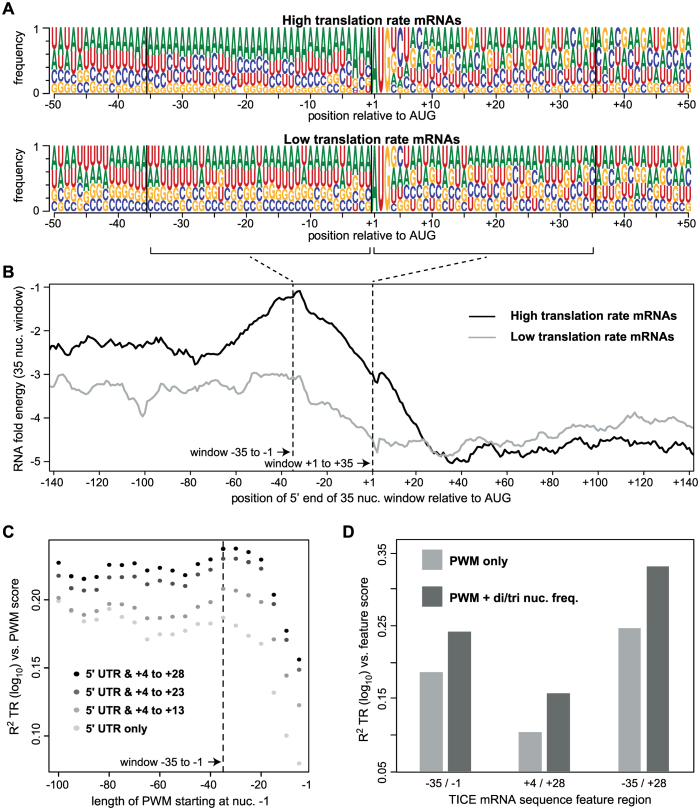
Figure 8.
The –35 to + 28 Translation Initiation Control Element (TICE). (A) Position weight matrices (PWMs) for the 10% of mRNAs with the highest TR scores (top) and the 10% of mRNAs with the lowest TR scores (bottom). Sequence logos show the frequency of each nucleotide at each position relative to the first nucleotide of the protein coding sequence (CDS) (Dataset S7). (B) The mean predicted RNA folding energy (ΔG, kcal/mol) of 35 nucleotide windows (y-axis). The x-axis shows the position of the 5′ most nucleotide of each window. Windows representing every one nucleotide offset were calculated. (C) The R2 coefficient of determination between translation rates (TR) and PWM scores. PWMs of varying lengths were built from the sequences of the 10% of mRNAs with the highest TRs, and then log odds scores were calculated for all mRNAs that completely contained a given PWM. PWMs extending 5′ from –1 in 5 nucleotide increments were tested (x-axis, right to left) and these were also extended 3′ from +4 in 5 or 10 nucleotide increments (grey to black scale). (D) The R2 coefficients of determination between TICE mRNA sequence features and TR. PWMs corresponding to the three specified TICE mRNA regions (–35/–1, +4/+28 and –35/+28) were used to score each gene (PWM only). Alternatively, PWMs and the frequencies of a small subset of dinucleotides and/or trinucleotides were scored for each gene (PWM + di/tri nuc. freq.) (Datasets S6 and S8).

