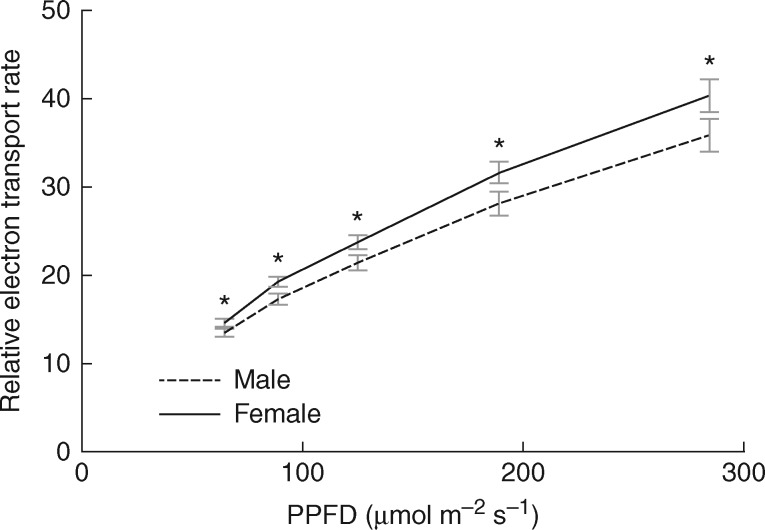
Fig. 3.
Photosynthetic photon flux density (PPFD) response curves comparing the relative electron transport rates (ETR) for males and females. Each point represents a mean of 12 Ceratodon purpureus individuals (four from each of three populations). Error bars indicate the s.e. A repeated measure ANOVA showed a significant interaction between light levels and sex (P = 0.02); asterisks indicate significant differences between males and females for t-tests at each light level (*P < 0.05).

